As I shared the other week, I’ve been working on a data competition with Kaggle and SeeClickFix involving 311 data from four cities: Chicago, New Haven, Oakland and Richmond.
So first things first – the competition is now live. Indeed, there are already 19 teams and 56 submissions that have been made. Fortunately, time is on your side, there are 56 days to go.
As I mentioned in my previous post on the subject, I have real hopes that this competition can help test a hypothesis I have about the possibility of an algorithmic open commons:
There is, however, for me, a potentially bigger goal. To date, as far as I know, predictive algorithms of 311 data have only ever been attempted within a city, not across cities. At a minimum it has not been attempted in a way in which the results are public and become a public asset.
So while the specific problem this contest addresses is relatively humble, I’d see it as a creating a larger opportunity for academics, researchers, data scientists, and curious participants to figure out if can we develop predictive algorithms that work for multiple cities. Because if we can, then these algorithms could be a shared common asset. Each algorithm would become a tool for not just one housing non-profit, or city program but a tool for all sufficiently similar non-profits or city programs.
Of course I’m also discovering there are other benefits that arise out of these competitions.
This last weekend there was a mini-sub competition/hackathon involving a subset of the data. It was amazing to watch from afar. First, I was floored by how much cooperation there was, even between competitors and especially after the competition closed. Take a look at the forums, they are probably make one of the more compelling cases that open data can help foster more people to want to learn how to manipulate and engage with data. Here are contestants sharing their approaches and ideas with one another – just like you’d want them to. I’d known that Kaggle had a interesting community and that learning played an important role in it, but “riding along” in a mini competition has caused me to look again at the competitions through a purely educational lens. It is amazing how much people both wanted to learn and share.
As in the current competition, the team at the hackathon also ran a competition around visualizing the data. And there were some great visualization of the data that came out of it, as well as another example of where people were trying to learn and share. Here are two of my favourites:
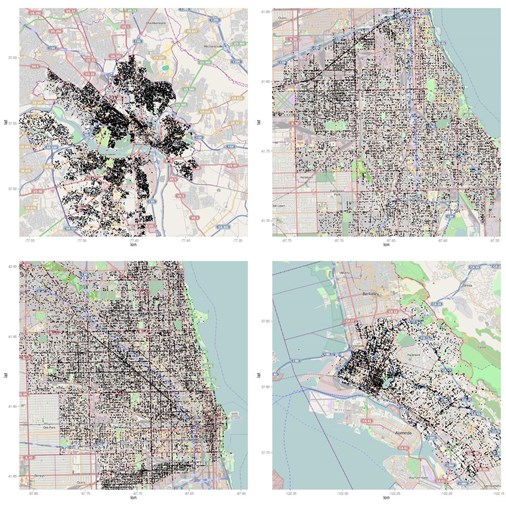
I love this visualization by Christoph Molnar because it reveals the different in request locations in each city. In some they are really dense, whereas in others they are much (more) evenly distributed. Super interesting to me.

I also love the simplicity of this image created by miswift. There might have been other things I’d done, like colour coded similar problems to make them easier to compare across cities. But I still love it.
Congratulations to all the winners from this weekends event, and I hope readers will consider participating in the current competition.

Super cool — congrats david!
Pingback: Open311 Data Prediction Challenge | Nick Grossman's Slow Hunch