(there is a section on this topic focused on governments below)
A hint of how social data could change journalism
Anyone who’s heard me speak in the last 6 months knows I’m excited about BuzzData. This week, while still in limited access beta, the site is showing hints its potential – and it still has only a few hundred users.
First, what is BuzzData? It’s a website that allows data to be easily uploaded and shared among any number of users. (For hackers – it’s essentially github for data, but more social). It makes it easy for people to copy data sets, tinker with them, share the results back with the original master, mash them up with other data sets, all while engaging with those who care about that data set.
So, what happened? Why is any of this interesting? And what does it have to do with journalism?
Exactly a month ago Svetlana Kovalyova of Reuters had her article – Food prices to remain high, UN warns – re-published in the Globe and Mail. The piece essentially outlined that food commodities were getting cheaper because of local conditions in a number of regions.
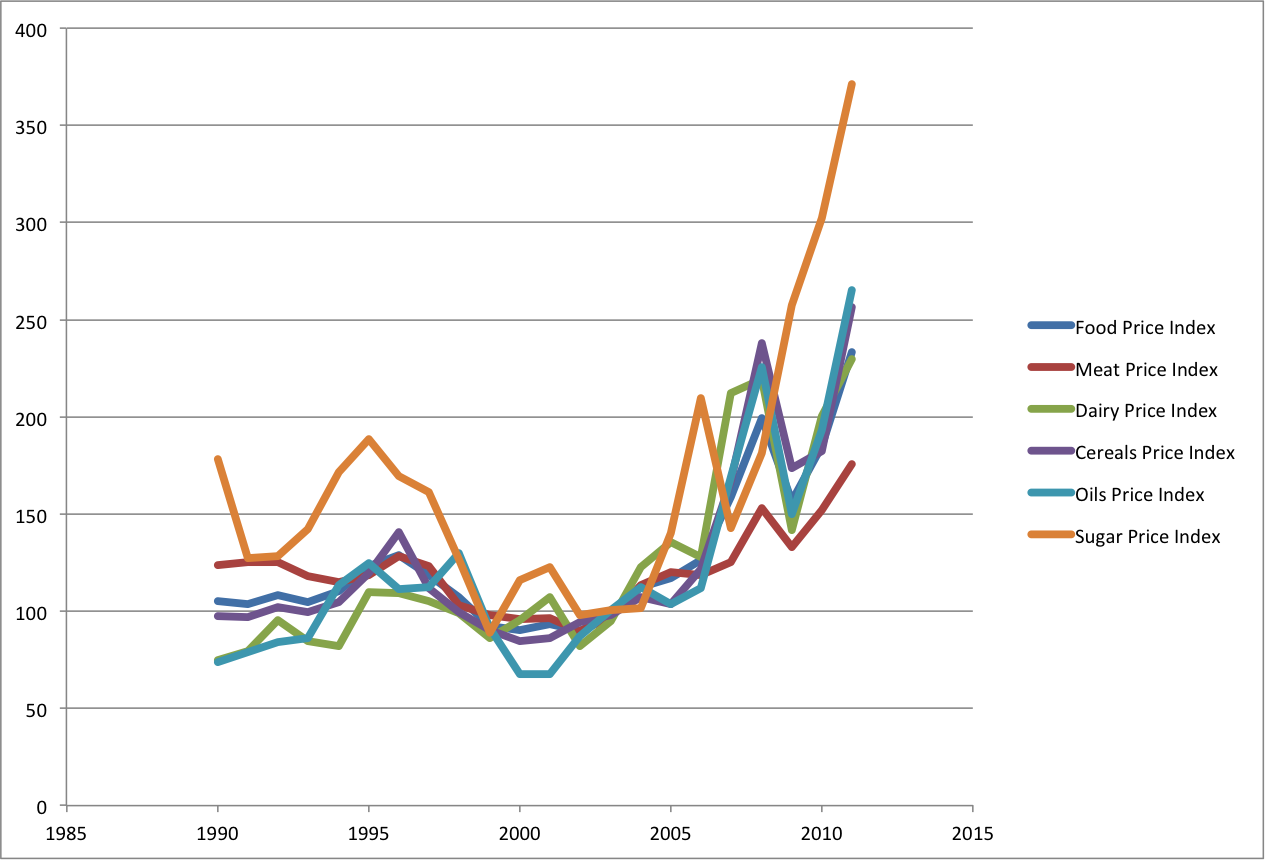
Someone at the Globe and Mail decided to go a step further and upload the data – the annual food price indices from 1990-present – onto the BuzzData site, presumably so they could play around with it. This is nothing complicated, it’s a pretty basic chart. Nonetheless a dozen or so users started “following” the dataset and about 11 days ago, one of them, David Joerg, asked:
The article focused on short-term price movements, but what really blew me away is: 1) how the price of all these agricultural commodities has doubled since 2003 and 2) how sugar has more than TRIPLED since 2003. I have to ask, can anyone explain WHY these prices have gone up so much faster than other prices? Is it all about the price of oil?
He then did a simple visualization of the data.
In response someone from the Globe and Mail entitled Mason answered:
Hi David… did you create your viz based on the data I posted? I can’t answer your question but clearly your visualization brought it to the forefront. Thanks!
But of course, in a process that mirrors what often happens in the open source community, another “follower” of the data shows up and refines the work of the original commentator. In this case, an Alexander Smith notes:
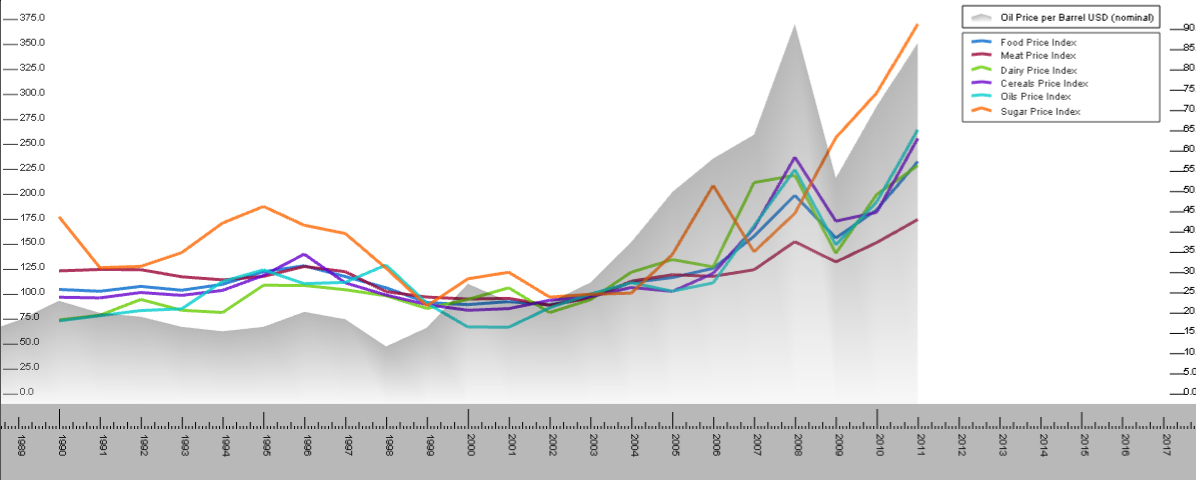
I added some oil price data to this visualization. As you can see the lines for everything except sugar seem to move more or less with the oil. It would be interesting to do a little regression on this and see how close the actual correlation is.
The first thing to note is that Smith has added data, “mashing in” Oil Price per barrel. So now the data set has been made richer. In addition his graph quite nice as it makes the correlation more visible than the graph by Joerg which only referenced the Oil Price Index. It also becomes apparent, looking at this chart, how much of an outlier sugar really is.
Perhaps some regression is required, but Smith’s graph is pretty compelling. What’s more interesting is not once is the price of oil mentioned in the article as a driver of food commodity prices. So maybe it’s not relevant. But maybe it deserves more investigation – and a significantly better piece, one that would provide better information to the public – could be written in the future. In either case, this discussion, conducted by non-experts simply looking at the data, helped surface some interesting leads.
And therein lies the power of social data.
With even only a handful of users a deeper, better analysis of the story has taken place. Why? Because people are able to access the data and look at it directly. If you’re a follower of Julian Assange of wikileaks, you might call this scientific journalism, maybe it is, maybe it isn’t, but it certainly is a much more transparent way for doing analysis and a potential audience builder – imagine if 100s or 1000s of readers were engaged in the data underlying a story. What would that do to the story? What would that do to journalism? With BuzzData it also becomes less difficult to imagine a data journalists who spends a significant amount of their time in BuzzData working with a community of engaged pro-ams trying to find hidden meaning in data they amass.
Obviously, this back and forth isn’t game changing. No smoking gun has been found. But I think it hints at a larger potential, one that it would be very interesting to see unlocked.
More than Journalism – I’m looking at you government
Of course, it isn’t just media companies that should be paying attention. For years I argued that governments – and especially politicians – interested in open data have an unhealthy appetite for applications. They like the idea of sexy apps on smart phones enabling citizens to do cool things. To be clear, I think apps are cool too. I hope in cities and jurisdictions with open data we see more of them.
But open data isn’t just about apps. It’s about the analysis.
Imagine a city’s budget up on Buzzdata. Imagine, the flow rates of the water or sewage system. Or the inventory of trees. Think of how a community of interested and engaged “followers” could supplement that data, analyze it, visualize it. Maybe they would be able to explain it to others better, to find savings or potential problems, develop new forms of risk assessment.
It would certainly make for an interesting discussion. If 100 or even just 5 new analyses were to emerge, maybe none of them would be helpful, or would provide any insights. But I have my doubts. I suspect it would enrich the public debate.
It could be that the analysis would become as sexy as the apps. And that’s an outcome that would warm this policy wonk’s soul.

So happy to see this piece, Dave! I think, being one of the first people BuzzData CTO Pete Forde hired, the most toe-tingling thing about this development for me is that this iss a real manifestation of a vision Pete aligned himself even though others’ had a hard time wrapping their heads around it at first.
Before BuzzData was built, I remember Pete talking about it and people always trying to repackage the vision into something they’d seen before: “So are you going to sell data, like infochimps?” or “So, you’re going be a visualization site like ManyEyes?” And while we’ve had great enthusiasm for BuzzData from people once they get it, sometimes it was hard to make people understand the value of a site that simply helps put data in context and (well-structured and user-friendly) community.
Excited to see more in the near future! We’ve had more data/CAR journalists join since, from the U.S., Canada, the U.K. and Europe.
Also: The site is now live :) Come one, come all … The more the merrier!
Hi Dave,
I agree data sharing sites like BuzzData are great for mash ups of data and that new sexy apps are not required. What is required is good visualization tools and many eyes and brains on the issue.
Correlation, even regresssion analysis, doesn’t equal cause and effect. We have to think through things. I did a fast Google search on Sugar Price Index and found the that Brazils’ production of sugar is expected to fall below last years level. Maybe the price of oil has nothing to do with sugar prices. Or perhaps it is more complicated, as Brazil turns sugar cane into ethanol because oil prices are high.
Brad
Food and Agriculture Organization of the UN.
Sugar rises on Brazil prospectsThe FAO Sugar Price Index rose 14 percent from May to June, reaching 359 points, 15 percent below its January record. Production in Brazil, the world’s biggest sugar producer, is forecast to fall below last year’s level.
http://www.fao.org/news/story/en/item/81577/icode/
Hi Brad, I think the point of the graph was to show that all the commodities except sugar track the price of oil…
—
http://www.eaves.ca
@daeaves
Sorry David, i know it’s not the point of the article but as a discussion started here and if some readers got an answer.. I’m intrigued now :)
So what could be correlated with sugar price ? Climate and predicted production in producing countries (india, brazil) ?
Raising demand from Asia (China) while less offer from brazil that now
uses sugar to make bioethanol…
Missing some new graphs with these data (or others)
My guess, is the rate of car ownership in Brazil and/or amount of sugar based bio-diesel produced. When I get more time I’ll see if I can dig up some stats. In the interim check out this chart. From 2003-08 car ownership went from 23 to 30M in Brazil. With growth of 31%(!!!) in 2008 and 29% in 2007.
Hi Dave
Very interesting stuff. The only “issue” I have with it is the subtle inference that just sticking data into an interesting visualization can reveal things to “non-experts” that, presumably, the journalists covering the topic for years would miss. I have no problem at all with the nice visualizations, but I think the point is that actual journalism might be enhanced when the graph or chart falls into well educated hands. For example, someone who reports on the commodities market could likely tell you how the relationship between sugar and oil might have less to do with the transportation cost of sugar than it has to do with speculation in the market.
A chart like the one shown in your article could help explain the complexities of the situation to the public, but if it will reveal something startling to someone who has been paying attention for years, I don’t know.
There is a reason people paid/pay as much as they did for the Bloomberg terminals…
Beth
Thank you for the comment Beth. I don’t really think we are in disagreement. My point is that by sharing the data more widely it increases the likelihood that it will fall into the hands of someone with useful additive knowledge.
Pingback: Open Source Data Journalism – Happening now at Buzz Data | eaves.ca – Media Strategery
The thing that bothers me a bit about this particular Pandora’s Box is that in right hands the information is additive, and in the wrong hands or malicious hands it can be used to manipulate and spread fear. You better believe that once a particular insight gets enough momentum, people will act on it, whether it is right or wrong. And I guess I wonder if having something like BuzzData changes that. Or will it just accelerate the inevitable?
On the other hand, having a good conversation about data and creating a conversation like the one we had above here really does educate us much more than journalists tend to do. Original insights, creating new insights from data points long forgotten or not analyzed, and confirming new trends is all a part of this new way to look at data.
Hi Dave. Thanks for sharing this other example of how putting data public can allow people to show things that were not necessarily obvious.
I see many questions on the comments on the validity of the correlations inferred from the graph. Great questions, great discussion started, great collaboration… and great value creation.
The Value creation of the Fourth Revolution is really just this. And I’m WOW’d everytime!
Hey Jeremie!
Are you actually on BuzzData? I’d love to follow you.
Pete
Hi Pete
Thanks for the hint… I have now registered and will follow with a lot of interest how BuzzData will develop. A great initiative for sure! Hopefully that’s provide me with good examples of the Fourth Revolution in action (have you visited the blog at http://www.thefourthrevolution.org and read the book?)
Hi Guys: Just found this on the web…What a great story. Glad to see how the cool folks at Buzzdata are helping to make a data “go viral” and allow more stories to be told out of data sets. We do hope that some of you will start to collect and share some data at Junar.com too. :-) (We love data as well!). Keep up the good work,
Pingback: Quora
Pingback: BuzzData: Come for the data, stay for the community - O'Reilly Radar