Category Archives: vancouver

Great Hacks from the Open Data in Vancouver

Last weekend I helped host an Open Data Day in Vancouver. With the generous support of Domain7, who gave us a place to host talks and hack, over 30 Vancouverites braved the sleet and snow to spend the day sharing ideas and working on projects.

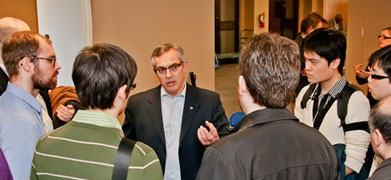
We had opening comments from Andy Yan – whose may be the most prolific user of Open Data in Vancouver, possibly Canada. I encourage you to check out his work here. We were also incredibly lucky to have Jeni Tennison – the Technical Director of the Open Data Institute – onsite to talk to participants about the ODI.

After the opening talks, people simply shared what they hoped to work on and people just found projects to contribute to. Minimal organization was involved… and here a taste of the awesome projects that got worked on! Lots of ideas here for other communities.

1. Open Data Licenses Resource: JSON + search + compatibility check = Awesome.

Kent Mewhort, who recently moved to Vancouver from Ottawa (via the Congo) updated his ongoing CLIPol project by adding some of the recently published licenses. If you’ve not seen CLIPol it is… awesome. It allows you to easily understand and compare the restrictions and rights of many open government licenses.

CLIPol Data

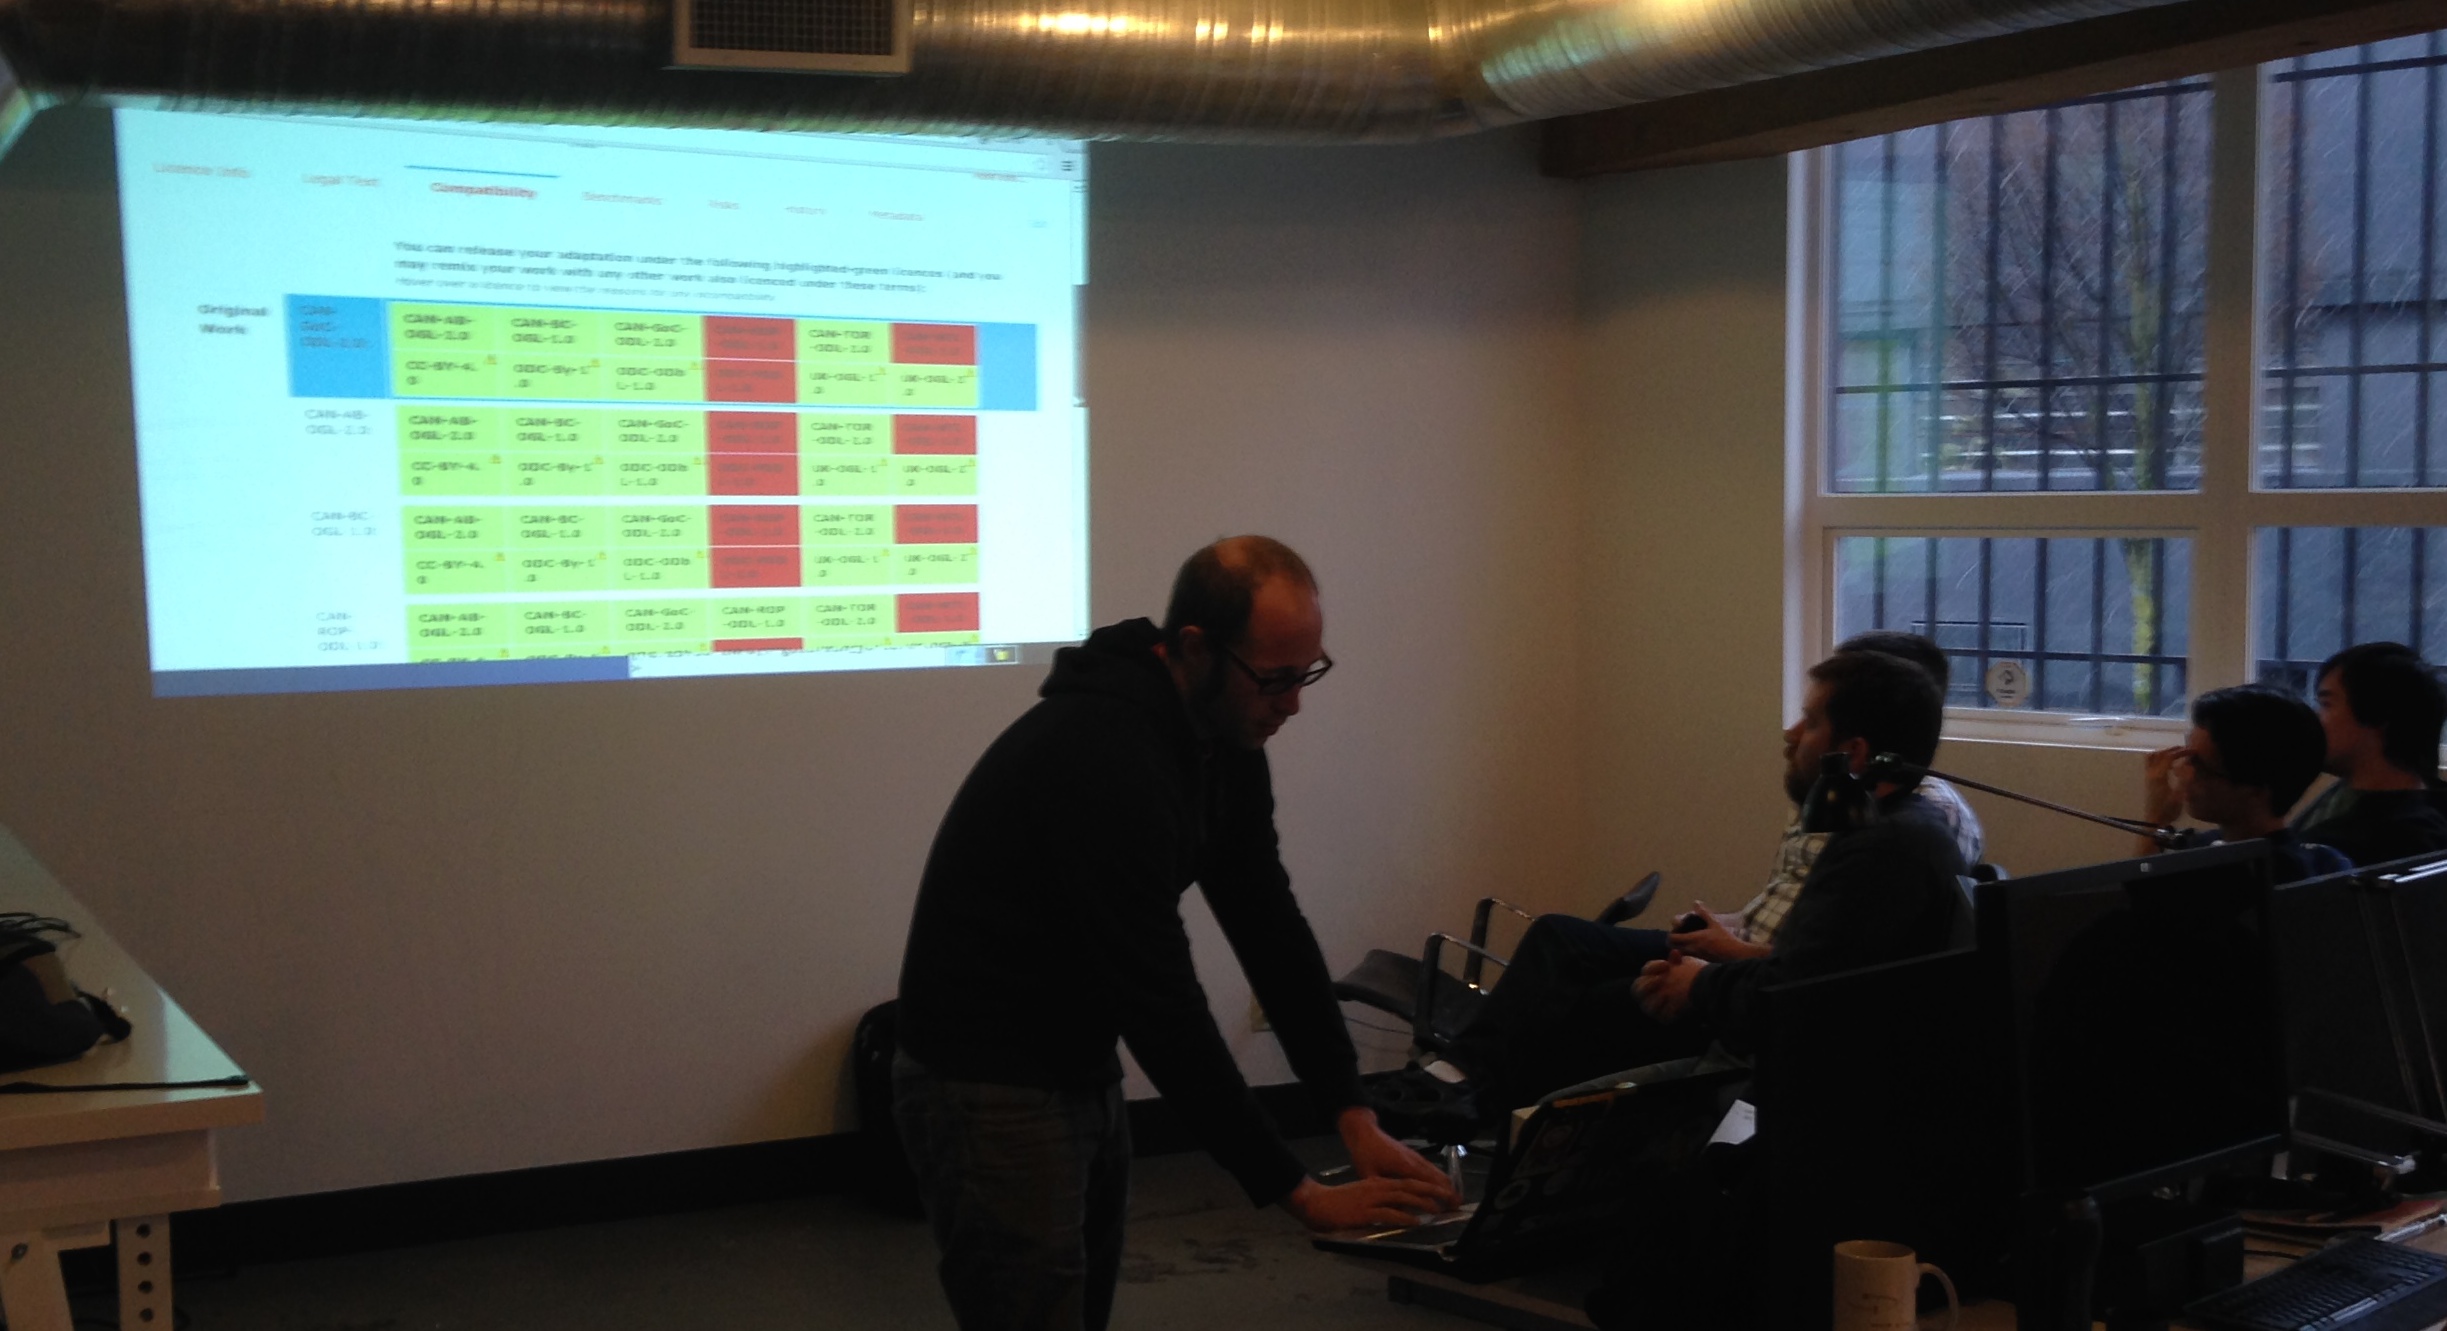
Better still CLIPol also lets you to see how compatible a license is (see example here). Possibly the best tool of all is one that allows you to determine what license you can apply to your re-mixed work in a way that is compliant with the original licenses (check out that tool here – screenshot below).

CLIPol compatibility

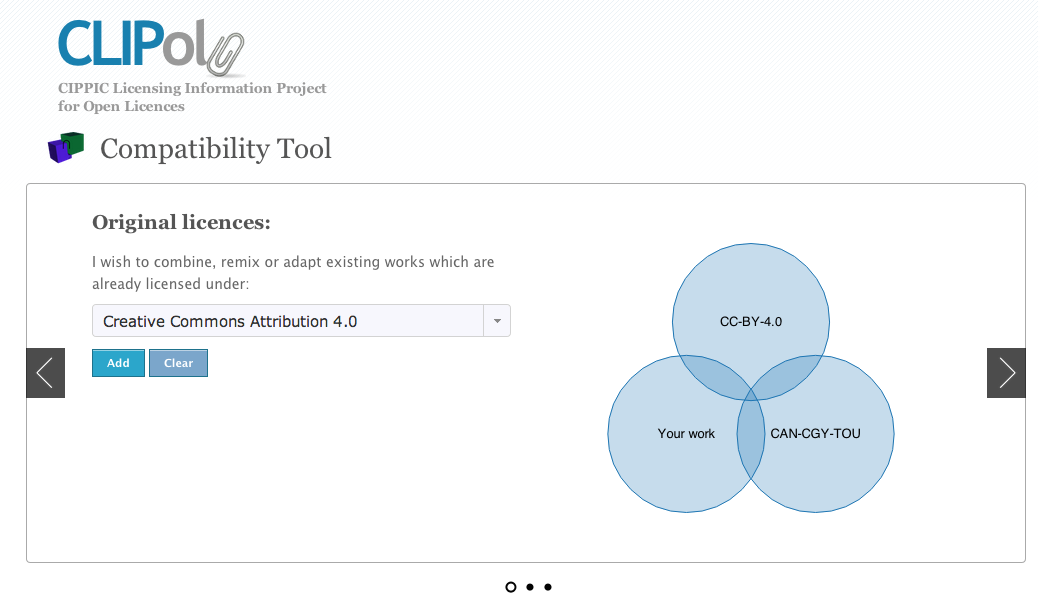
CLIPol is just such a fantastic tool – can’t recommend it enough and encourage people to add more licenses to it.

2. Vancouver in MineCraft

I have previously written about how Minecraft is being used to help in public consultations and urban planning – I love how the game becomes a simple tool that enables anyone to shape the environment.

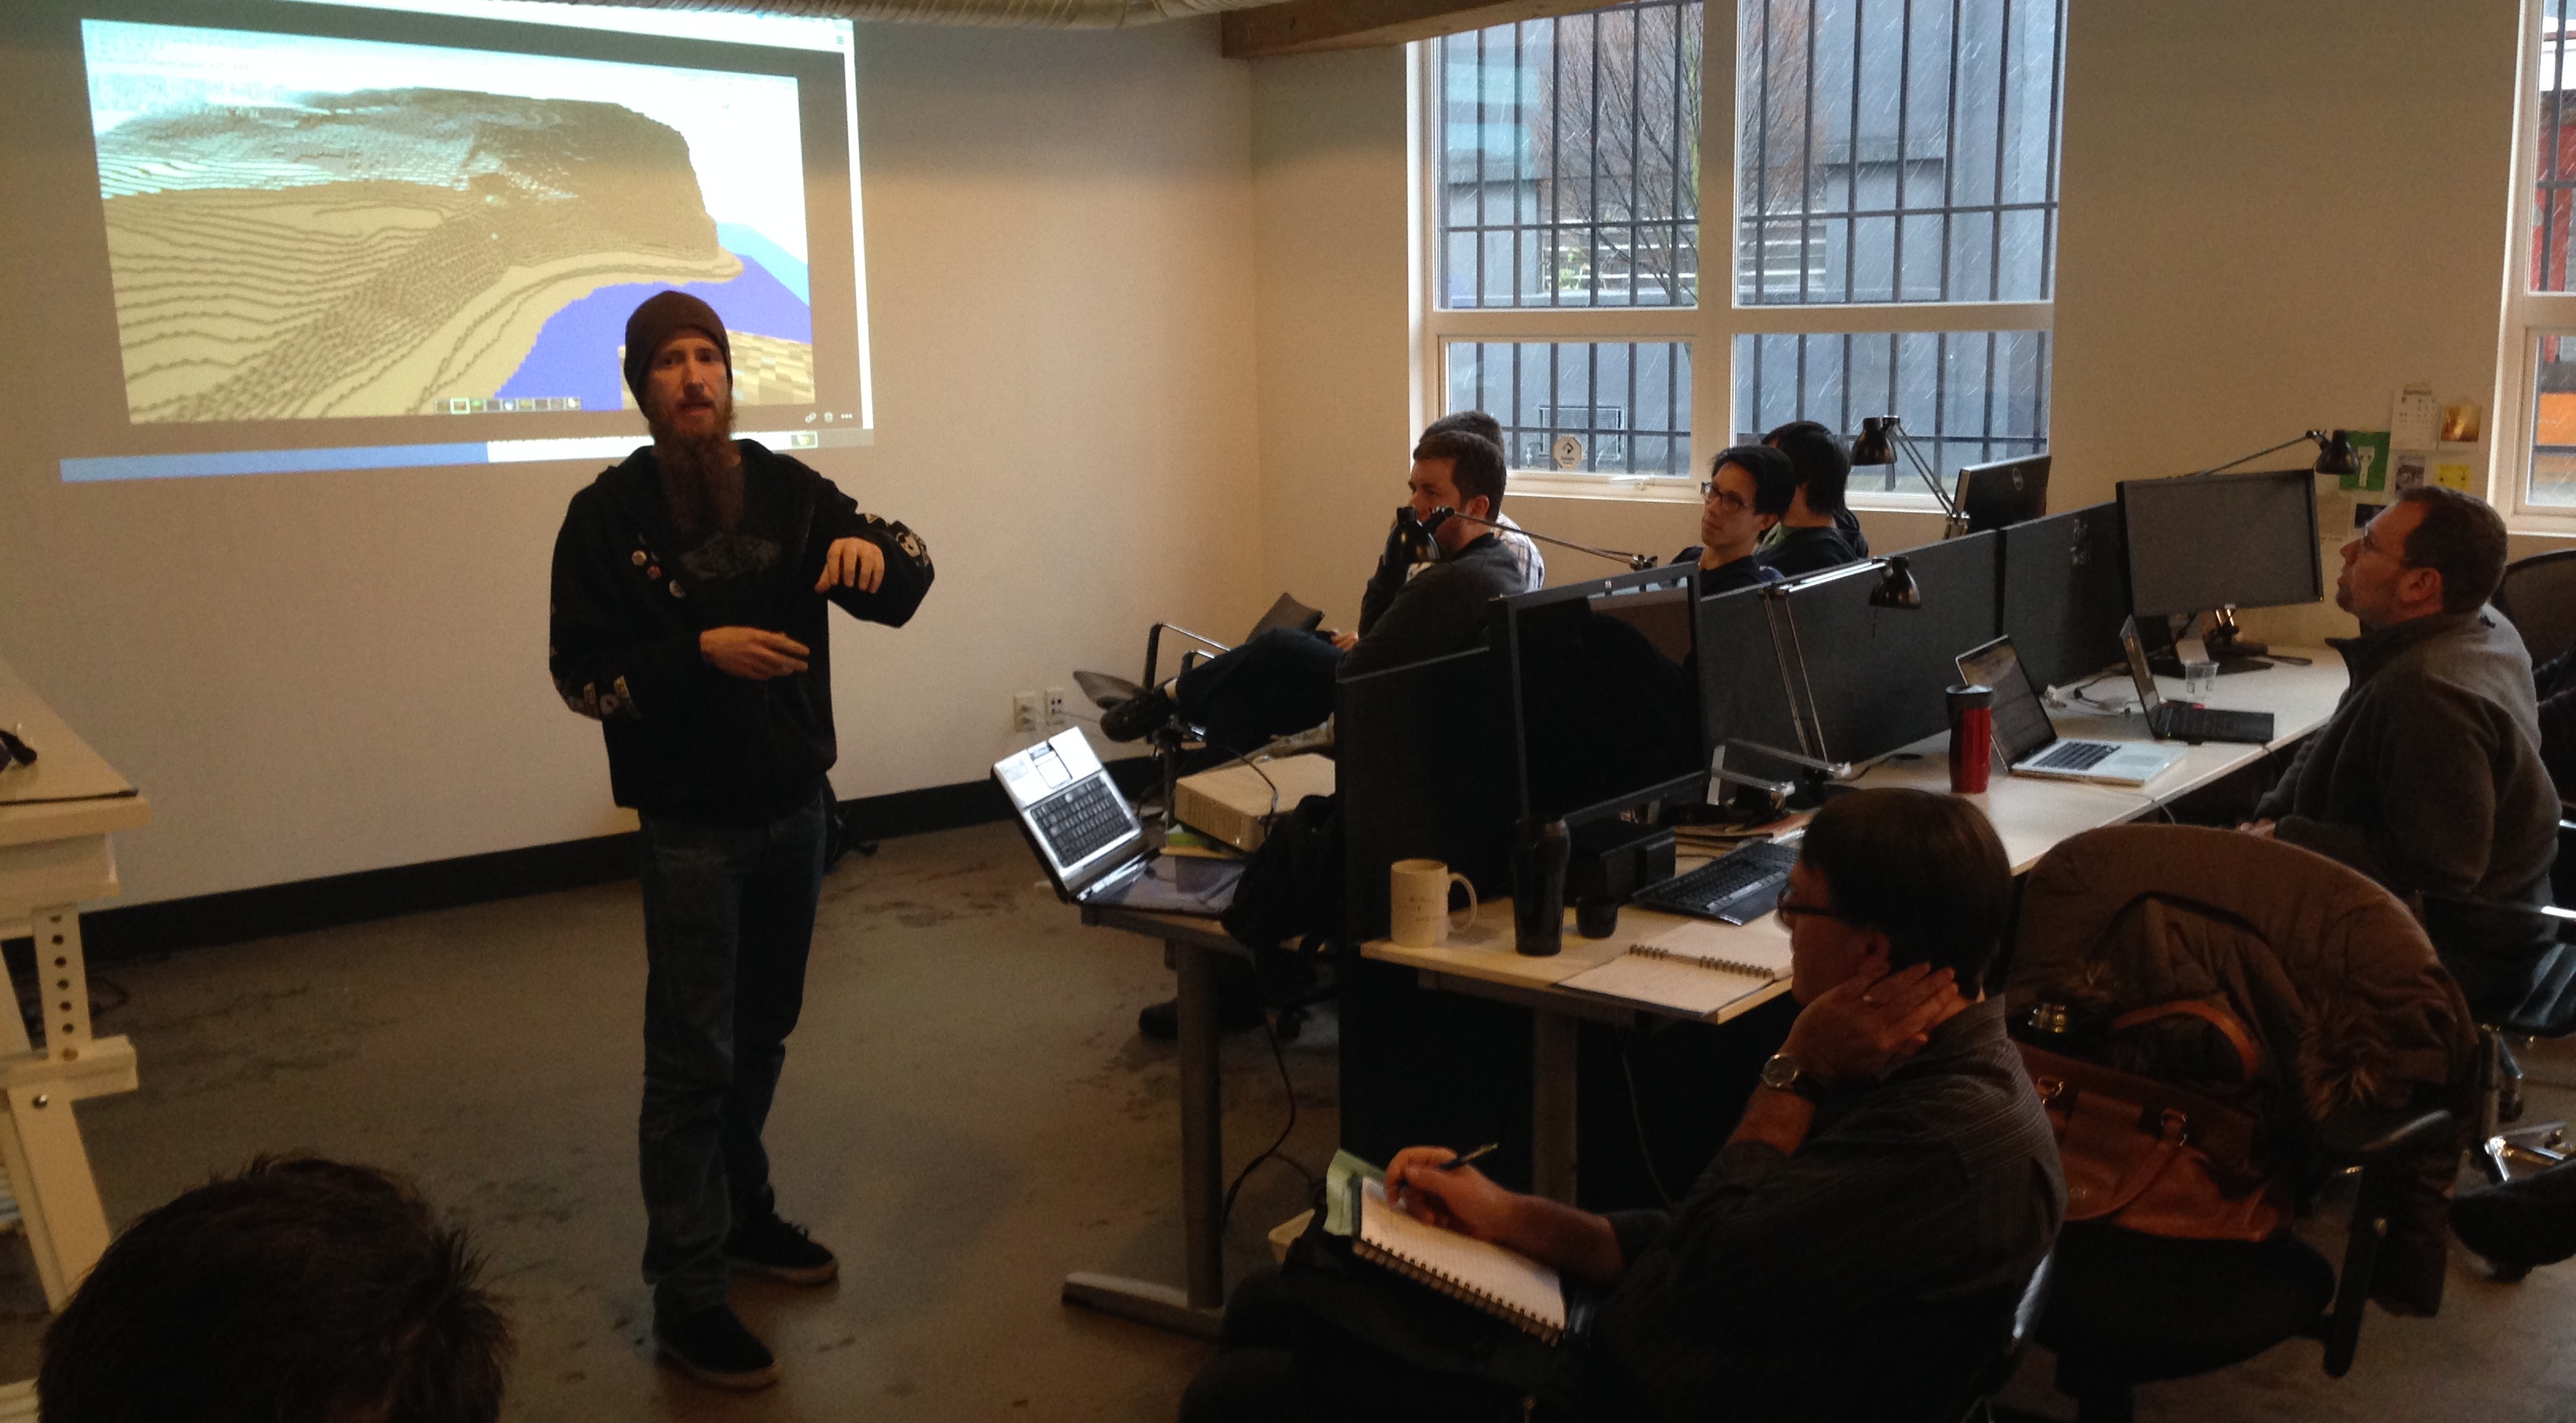
So I was crazy excited I heard that Ryan Smith (aka Goldfish) had used the City of Vancouver’s open elevation data to recreate much of the city in Minecraft.

Below is a photo of Ryan presenting at the end of the day. The projection behind him shows Stanley park, near Siwash Rock. The flat feature at the bottom is the sea wall. Indeed Ryan notes that the sea wall makes for one of the clearest features since it creates almost perfectly flat structure along the city’s coast.

Mincraft Data

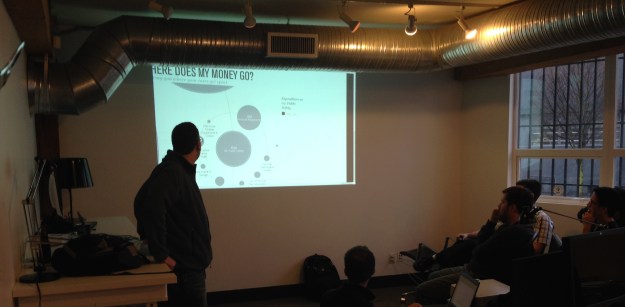
3. Vancouver’s Capital Budget Visualized in Where Does my Money Go

It is hard to imagine a project going better. I’m going to do a separate blog post on it.

This is a project I’ve always wanted to do – create a bubble tree visualization with Where Does my Money Go. Fortunately two developers – Alexandre Dufournet and Luc Lussier – who had never hacked on open data jumped on the idea. With help from City of Vancouver’s staff who were on site, I found a PDF of the capital budget which we then scraped.

WDMYG Data

The site is not actually live, but for developers who are interested in seeing this work (hint, hint City of Vancouver staff) you can grab their code from github here.

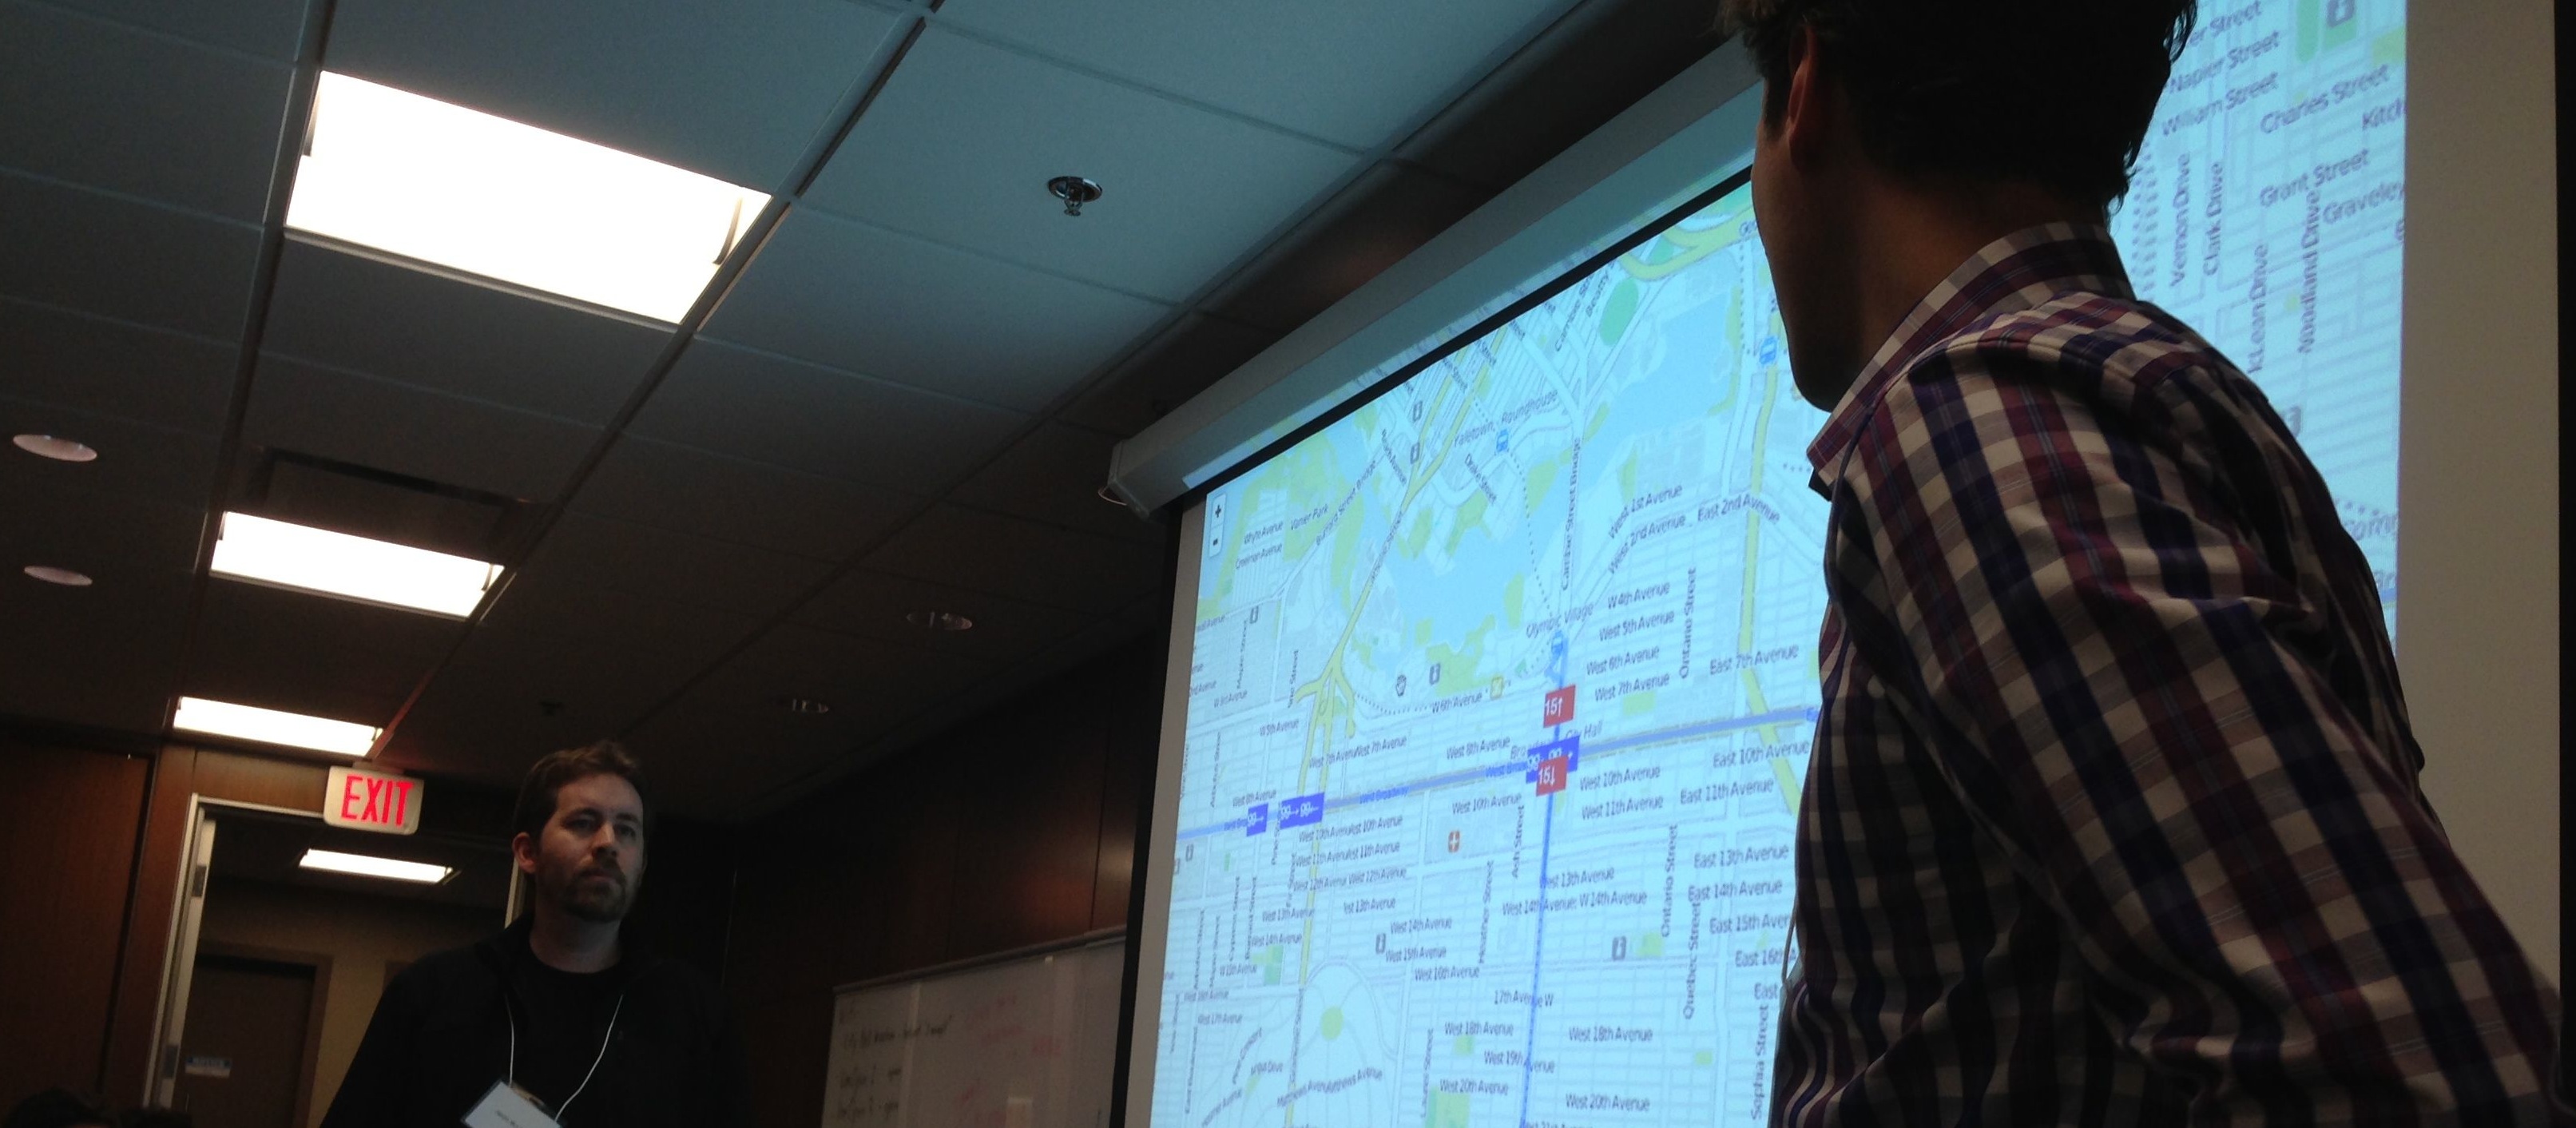
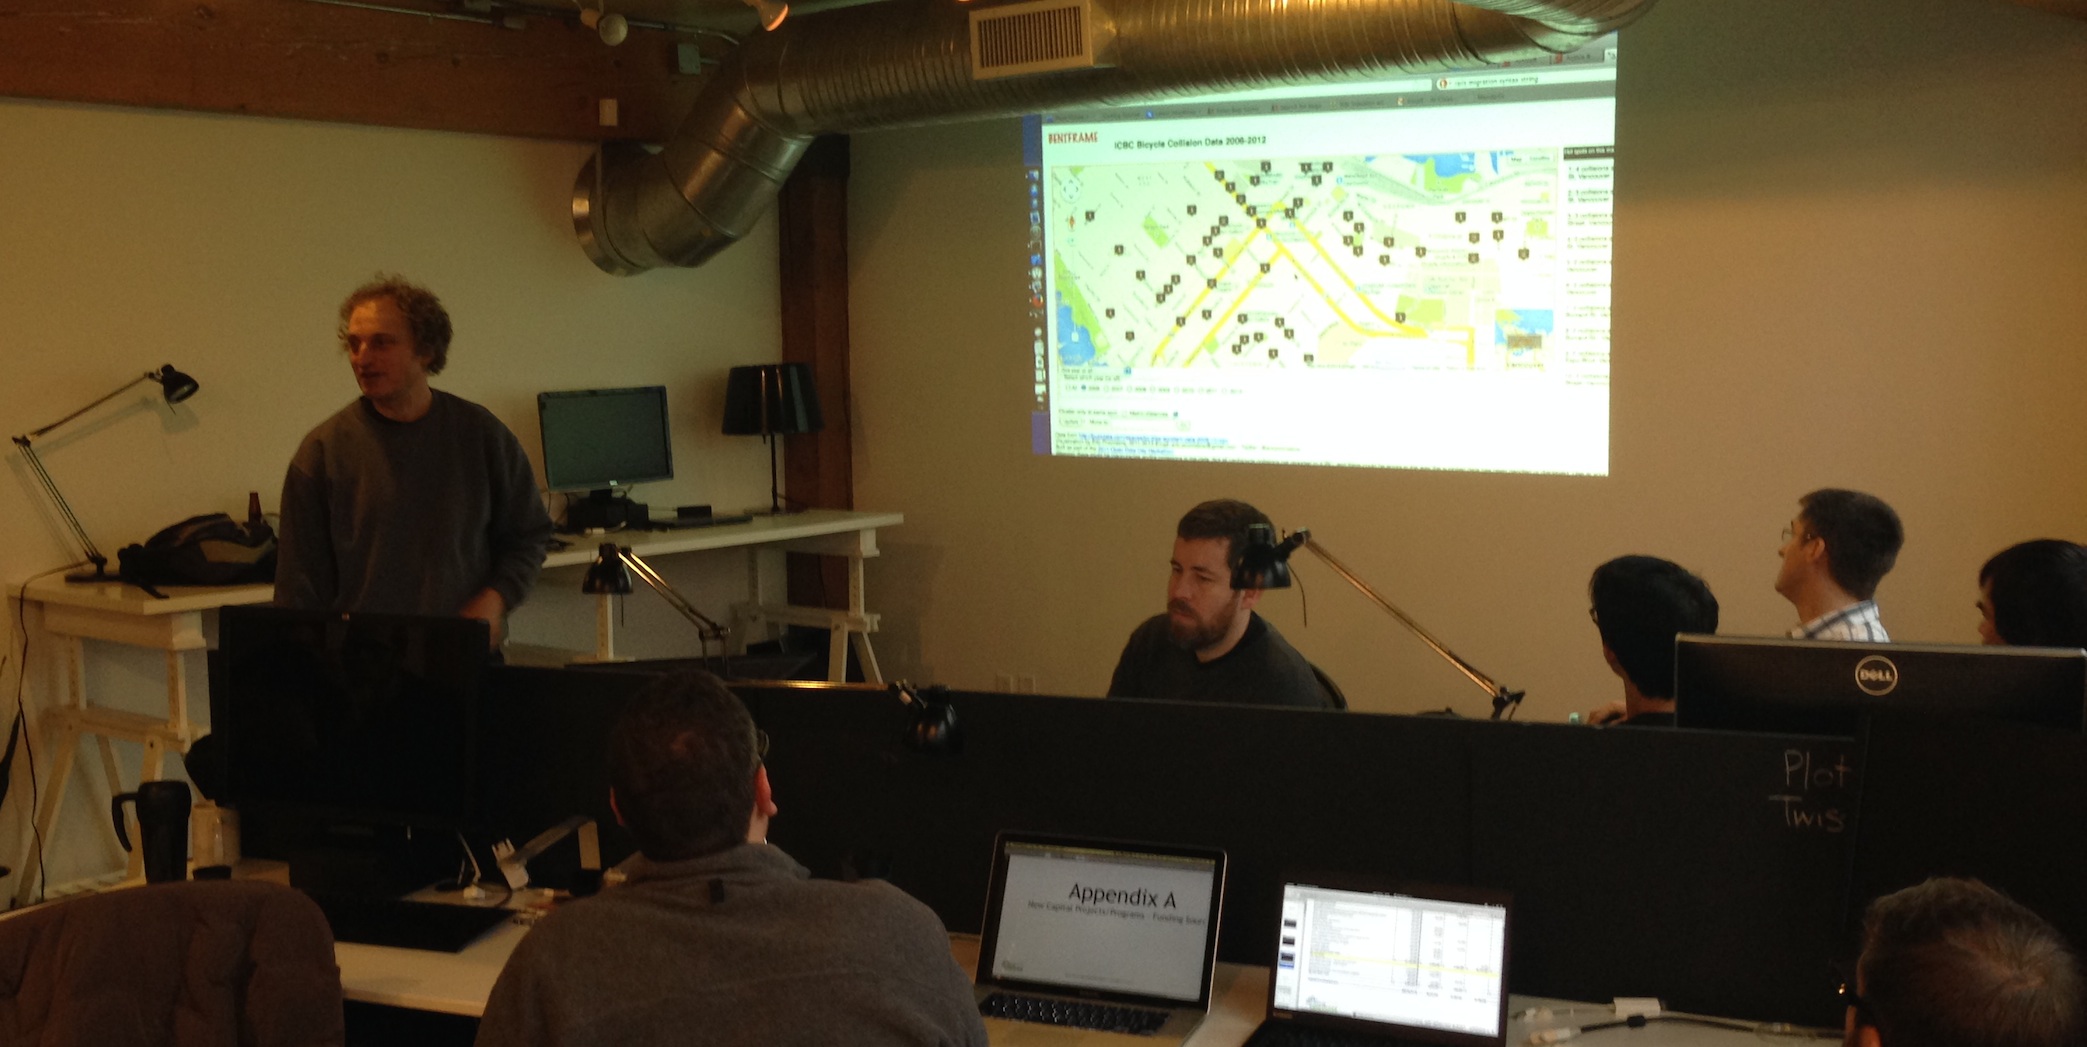
4. Monitoring Vancouver’s Bike Accident Data – Year 3

Eric Promislow has been coming to Open Data Hack-a-thons ever since Luke Closs and I started organizing them in 2009. During the first Open Data Day in 2011 you can read in my wrap up post about a bike accident monitoring website Eric created that day which Eric would eventual name Bent Frame. Well, Bent Frame has been live ever since and getting bigger. (Eric blogs about it here)

Each open data day, Eric updates Bent Frame with new data from ICBC – the province’s insurance monopoly. With over 6 years of data now in Eric is starting to be able to analyze trends – particularly around the decline of bike accidents along many roads with bike lanes, and an increase in accidents where the bike lanes end.


Bike Data

I initially had conversations with ICBC to persuade them to share their data with Eric and they’ve been in touch with him ever since, passing along the data on a regular basis. It is a real example of how an active citizen can change an organization’s policies around sharing important data that can help inform public policy debates.

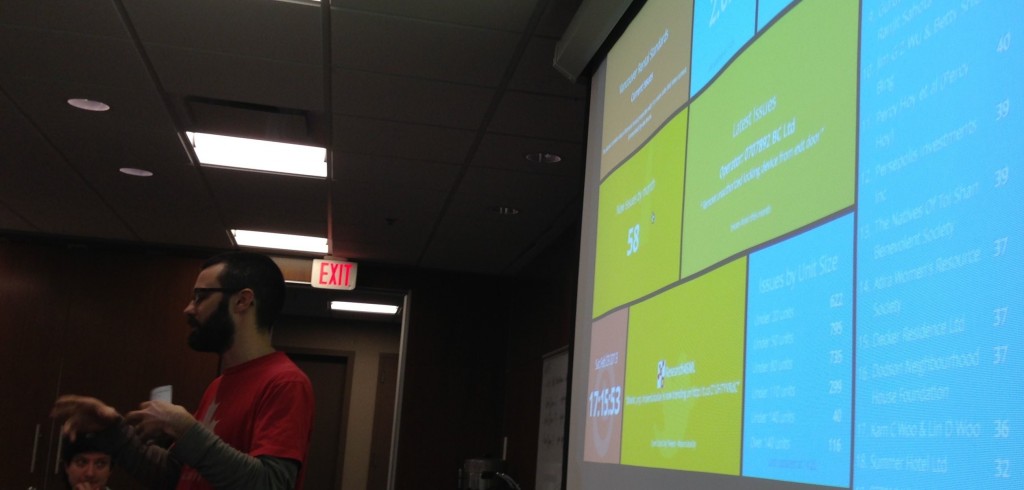
5. ProactiveDisclosure.ca – Making government information easier to search

Kevin McArthur is the kind of security guy most governments dreads having around but should actually love (example his recent post on e-voting).  He continued to hack on one of his side projects: proactivedisclosure.ca. The site is a sort of front end for open data sets, making it easier to do searches based on people or companies. Thus, want to find all the open data about a specific minister… proactive disclosure organizes it for you.

Proactive Data

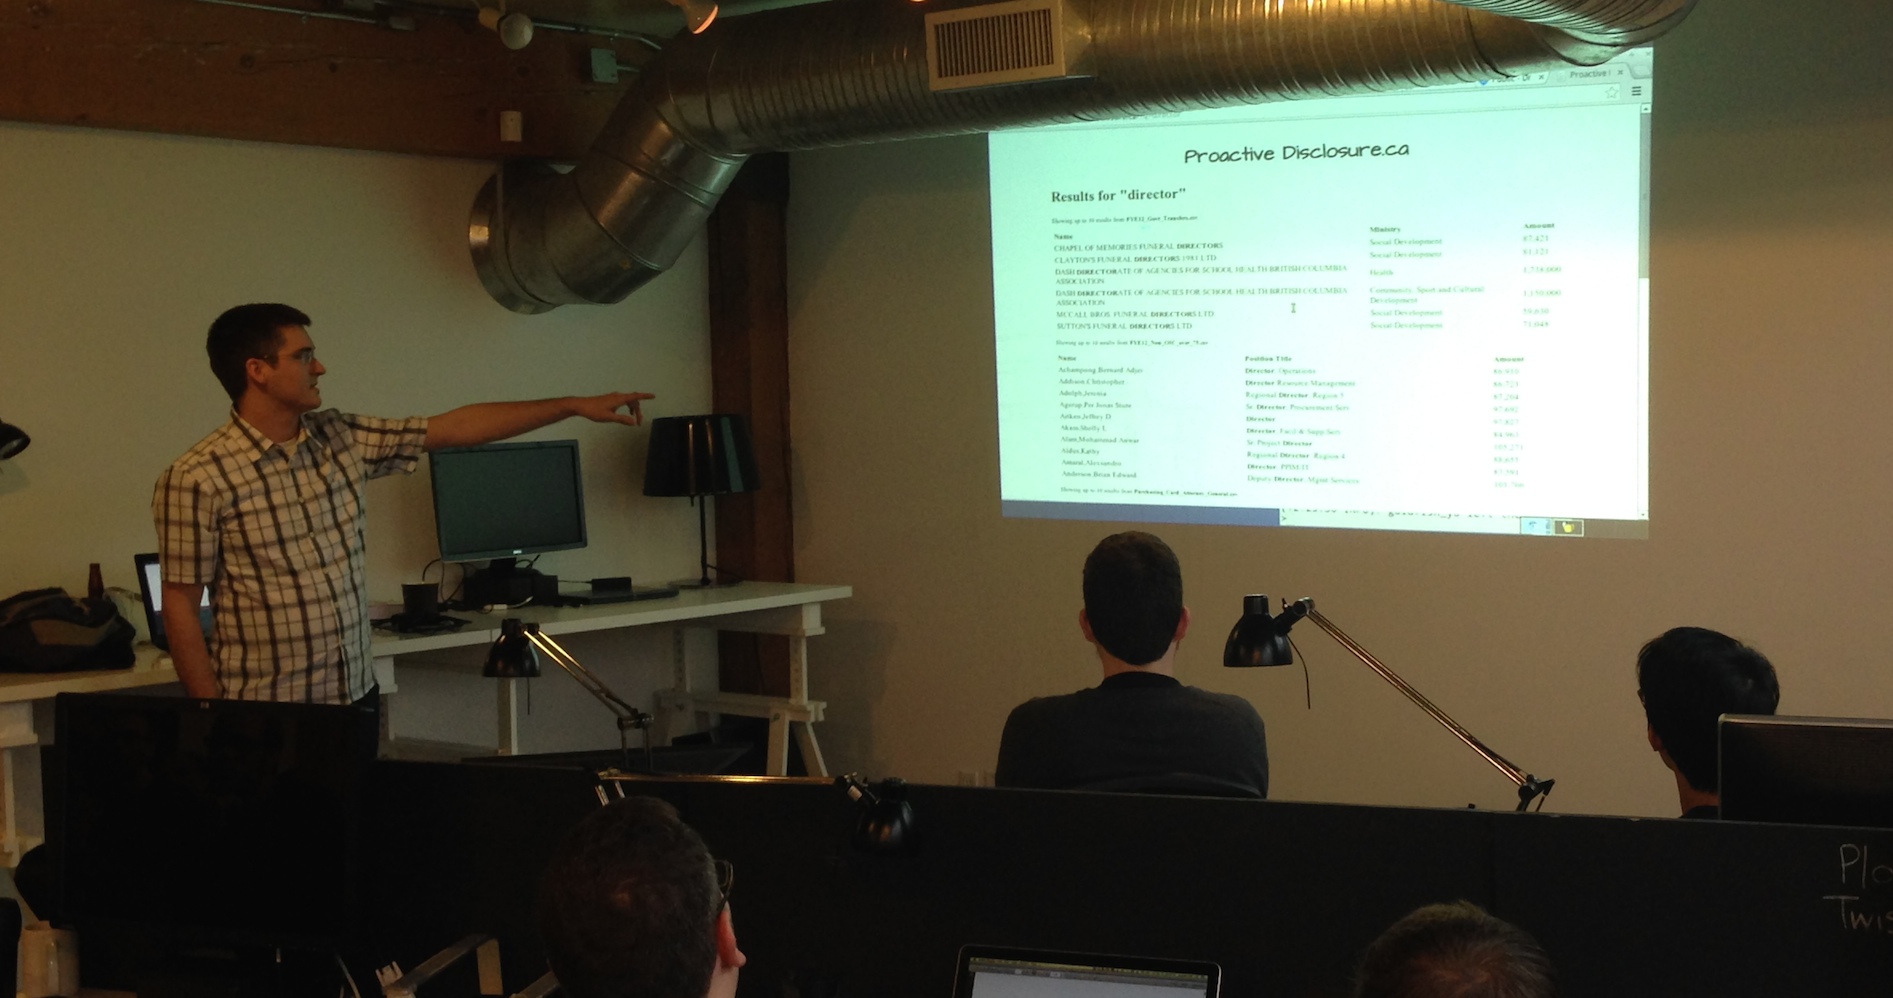
Kevin and a small team of players uploaded more data into their site and allowed it to consume unstructured data. Very cool stuff.

6. Better Open Data Search

Herb Lainchbury – another fantastic open data advocate – worked on a project in which he tried to rethink what an open data search engine would look like. This is a topic that I think matters A LOT. There is simply not a lot of good ways to find data that you are interested in.

Herb’s awesome insight was invert the traditional way of thinking about data search. He created a search engine that didn’t search for the data set keywords or titles, but rather searched the meta data exclusively.

One interesting side outcome of this approach is that it made related data sets easier and, made locating identical data sets but from different years a snap. As Herb notes the meta data becomes a sort of “finger print” that makes it easy to see when it has been duplicated. (Quick aside rant: I loath it when governments releases 20 data files of the same data set – say crime data – with each file representing a different year and then claiming that it is 20 unique data sets in their catalogue. No. It is one data set. You just have 20 years of it. Sigh).

7. School Performance Chart

Two local video game programers – Louie Dinh and Raymond Huang – with no experience in open data looked around the BC Government Open Data catalogue and noticed the data on test scores. Since they attended school here in British Columbia they thought it might be interesting to chart the test scores to see how their own schools had preformed over time.

They were able to set up a site which graphed how a number of elementary schools had performed over time by looking at the standardized test scores.

Test SCore Data

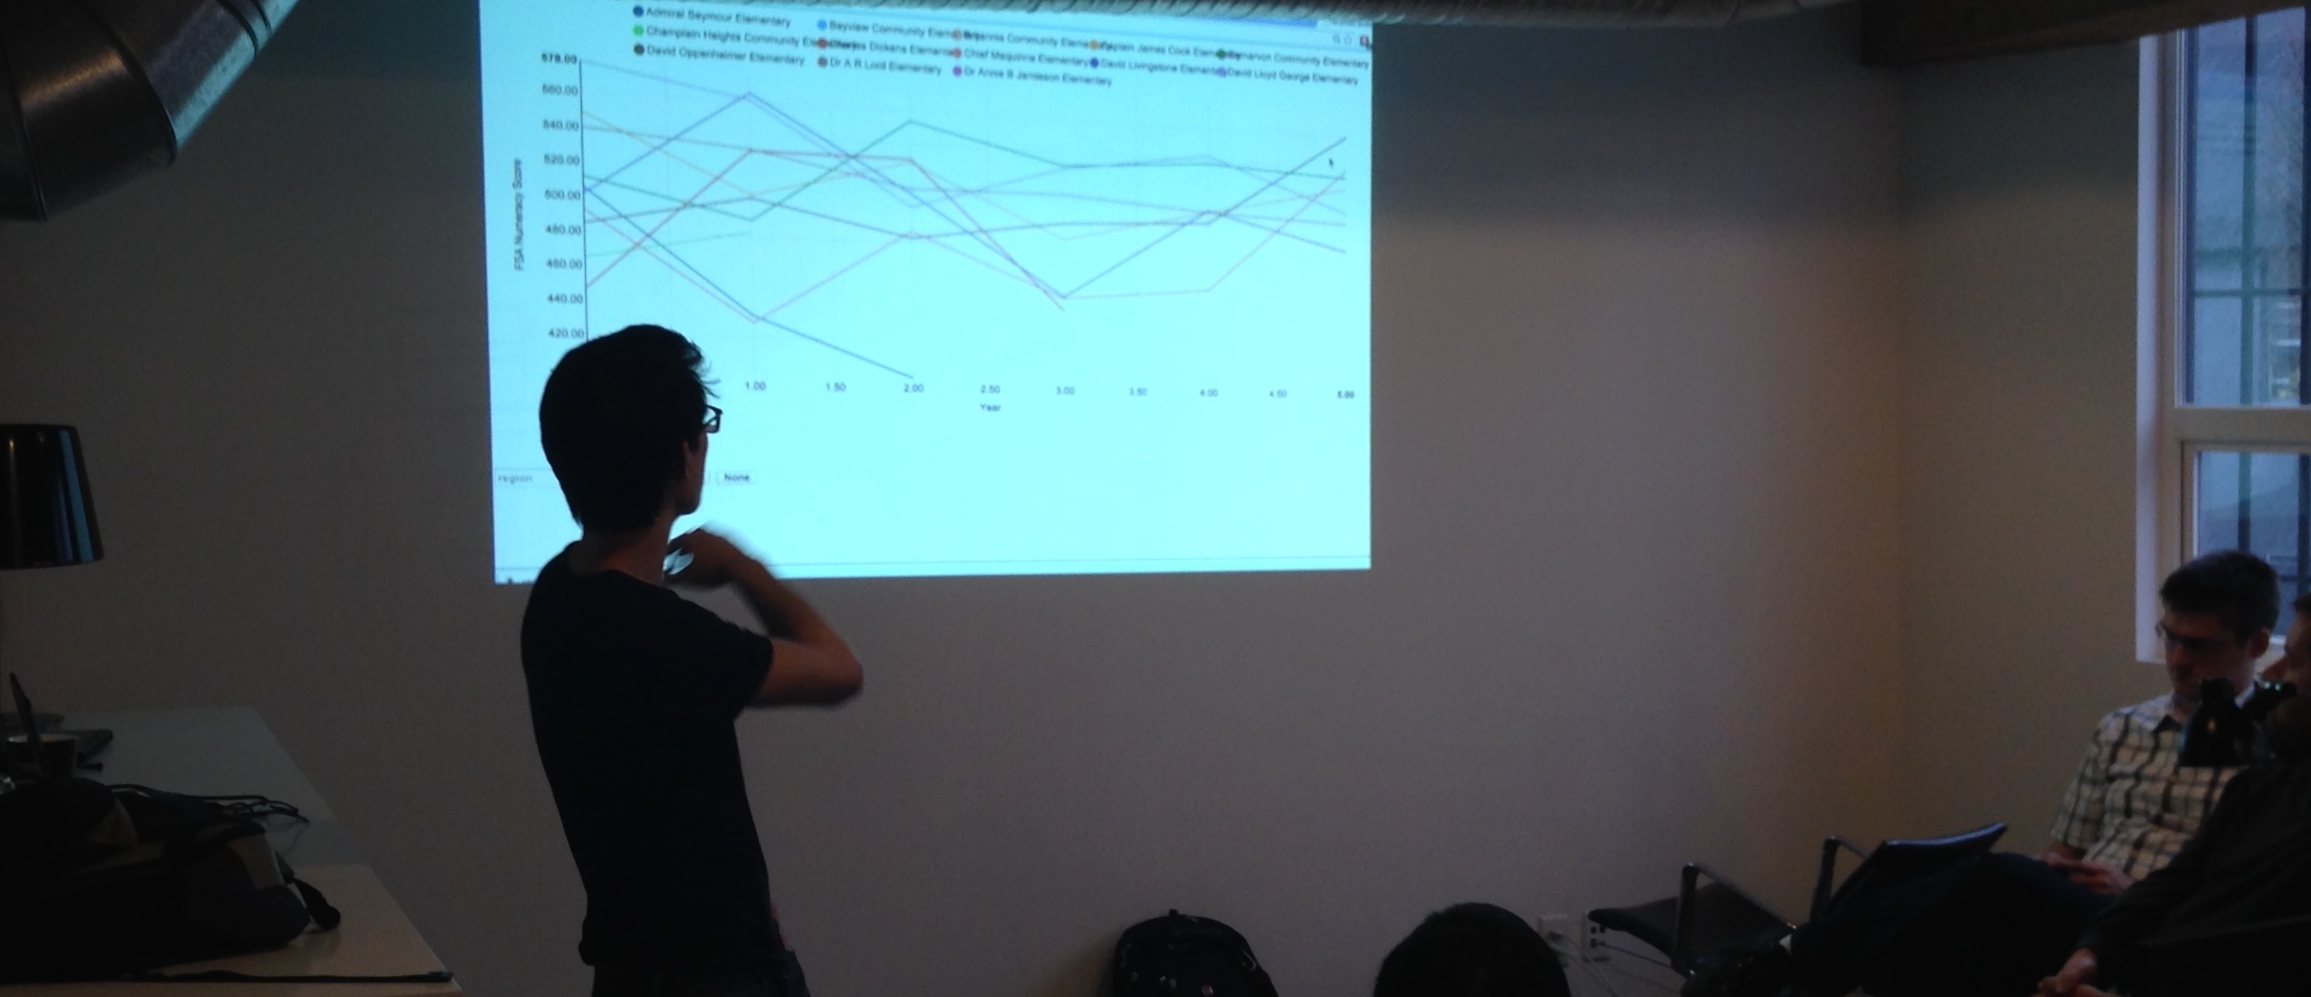
This is just a great example of data as a gateway to learning. Here a simple hackathon project become a bridge for two citizens to dive into a area of public policy and learn more about it. No one is claiming that there chart is definitive, rather it is the start of a learning process around what matters and what doesn’t and what can be measured and what can’t in education.

Congratulations to everyone who participated in the day – thank you for making it such an amazing success!

StreetMix for testing bike lanes – Burrard St. Bridge Example

I’m MCing the Code for America Summit at the moment, so short on time to write a post, but I’m just LOVING StreetMix so much I had to give it a shout out. If you are a councillor, urban planner or community activist, StreetMix is a site you HAVE to check out.

What does it do? I basically allows you to create or edit and street you want. It is so simple to use it takes about 1 minute to master. At that point, you can build, copy and redesign any street in the world.

Here, for example I’ve recreated the Burrard St. Bridge in Vancouver as it exists today, with bike lanes and below, as it existed before the addition bike lane.

Burrard Bridge new

Burrard Bridge old

Open Data Day 2013 in Vancouver

Better late than never, I’m going to do a few posts this week recapping a number of ideas and thoughts from Open Data Day 2013. As is most appropriate, I’m going to start the week with a recap of Vancouver – the Open Data Day event I attended and helped organize along with my friend Luke Closs and the very helpful and supportive staff at the City of Vancouver – in particular Linda Low and Kevin Bowers. I’ve got further thoughts about the day in general, its impact and some other ideas I’ll share in subsequent posts.

Vancouver! 2013!

What made Open Data Day in Vancouver great for me was that we had a range of things happen that really balanced time between “creating” (e.g. hacking) and engagement. As a result I’m diving this blog post into three parts: setting the scene, engagement and outcomes as well as sharing some lessons and best practices. My hope is that the post will make for fun reading for regular readers, but the lessons will prove helpful to future open data day organizers and/or plain old hackathon organizers.

Setting the scene

City hall photo by Roland

Despite competing with a somewhat rare sunny day in Vancouver at this time of year we had over 80 participants show up at City Hall, who graciously agreed to host the room. Backgrounds varied – we had environmentalists, college and university students, GIS types, open street mappers, journalists, statisticians among others. In addition, the city’s administration made a big commitment to be on hand. Over 20 staff were present, including one of the Deputy City Managers and a councillor – Andrea Reimer – who has been most active and supportive on the Open Data file. In addition we had a surprise guest – Federal Minister Tony Clement, who is the minister responsible for Open Data with the national government.

Our event was fairly loosely organized. We had a general agenda but didn’t over script anything. While Luke and I are comfortable with relatively flexible agenda for the day, we knew the unstructured nature of the event was a departure for some from the city and were grateful that they trusted us both with the format and with the fast, loose and informal way we sought to run the day.

Here are some high level lessons:

  • When Possible host it Somewhere Meaningful. City Hall is always nice. Many attendees will have never engaged with local government before, this creates a space for them to learn and care about municipal government. It also reaffirms the broader culture changing and social/change oriented goals of an open data hackathon. Besides, who isn’t welcome at City Hall? It sets a great tone about who can come – which is pretty much anyone.
  • Give the Politicians Some Room. Don’t be afraid to celebrate politicians and leaders who have championed the cause. Hackathons are about experimenting, not talking, so Andrea’s five minute talk at the beginning was the right mix of sincere engagement, enthusiasm and length.
  • Don’t Only Attract Software Developers. Vancouver’s event was in part a success because of the diversity of participants. As you’ll see below, there are stories that emerged because we tried hard to engage non-software developers as well.
  • Transit. This may sound obvious but… if you want to attract lots of people make it convenient to get to. We right off the subway line – City Hall is pretty central.
  • RSVP. We did one thing wrong and one thing right. On the wrong side, we should have allowed more people to register recognizing that not everyone would show. We’d turned people away and ended up having room for them because of the no shows. On the right side, we blasted our list to see if anyone wasn’t going to come at the last minute and, got some responses, which allowed us to re-allocate those seats.

Engagement: Open Dataing

Speed Dating with Minister Clement

The one thing both Luke and I were committed to doing was getting participants and city staff to talk to one another. Building off an idea Luke witnessed in Ottawa we did 45 minutes of Open “Dataing.” During this period city staff from about eight different departments, as well as Minister Clement, staked out a part of the room. We then had people cluster – in groups of about 5-7 – around a department whose data or mission was of interest to them. They then had 10 minutes to learn about what data was available, ask questions about data they’d like, projects they were thinking of working on, or learn more about the operations of the city. In essence, they got to have a 10 minute speed date on data with a city official.

After 10 minutes blew a whistle and people went and clustered around a new official and did it all over again.  It was a blast.

Key Lessons:

  • Open Dataing is about getting everyone engaged. Helping public servants see what citizens are interested in and how they can see technology working for them, it’s also about getting participants to learn about what is available, what’s possible, and what are some of the real constraints faced by city staff
  • I wish we’d had signs for the various departments being represented, would have made it easier for people to find and gravitate towards the issues that mattered most to them.
  • This type of activity is great early on, it’s a way to get people talking and sharing ideas. In addition, we did the whole thing standing, that way no one could get too comfortable and it ensure that things kept flowing.

Outcomes

After the dating, we did a brief run through of projects people wanted to work on and basically stepped back and hacked. So what got worked on? There were other projects that were worked on, but here are the ones that saw presentations at the end of the day. There are some real gems.

Bike Parking App 

The Bike Rack app came out of some challenges about data gathering that Councillor Reimer shared with me. I suggested the project and a team of students from UBC’s Magic Lab turned it into something real.

The city recently released a data set of the locations of all city owned bike racks. However, the city has little data about if these locations are useful. So the app that got hacked is very simple. When you arrive at your destination on bike you load it up and it searches for the nearest bike rack. For the user, this can be helpful. However, the app would also track that lat/long of where the search was conducted. This would let city planners know where people are when looking for bike rack so they would start to have some data about underserved locations. Very helpful. In addition, the app could have a crowdsourced function for marking the location of private bike racks (managed by businesses) as well as an option to lat/long where and when your bike was stolen. All this data could be used to help promote cycling, as well as help the city serve cyclists more effectively.

Homelessness Dashboard

Luke showing off his rental dashboard

My friend Luke connected a Raspberry Pi device to one of the giant TVs in the room where we were working to share the work he had done to create a dashboard based on the city’s rental standards database.  Luke’s work even got featured on the Atlantic’s website.

Crime mapping – lots of quality questions

One great project involved no software at all. We had some real data crunchers in attendance and they started diving into the Vancouver Police Department’s data with a critical eye. I wish the VPD could have been there since their conclusions were not pretty. The truth is, the Vancouver Police department makes very little data open, and what it does make, is not very good. What was great to see were some very experienced statisticians explain why. I hope to be able to share the deck they created.

Air quality egg

A few weeks prior to Open Data Day I shared that I’d be launching a project – with the help of the Centre for Digital Media – around measuring air quality in Vancouver. Well, the air quality egg we’d ordered arrived and our team started exploring what it would, and might not, allow us to do. The results were very exciting. Open Data Day basically gave us time to determine that the technical hurdles we were worried about are surmountable – so we will be moving forward.

Over the coming months we’ll be crafting a website that uses Air Quality Eggs to measure the air quality in various neighborhoods in Vancouver. We have a number of other community partners that are hoping on board. By Clean Air Day  we’d love to have 50-100 air quality eggs scattered across various neighborhoods in greater Vancouver. If you are interested in sponsoring one (they are about $150) please contact me.

Youth Oriented events RSS feed

One intrepid participant, also not a developer, got the city to agree to create and share an RSS feed of youth oriented events. This was important to them as they were concerned with youth issues – so a great example of a community organizer getting a data resource from the city. Next steps – trying to get other organizations with youth organized events to agree to share their program data in a similar data schema. What a great project.

Provincial Crowdsourced Road Kills and Poaching Maps

I was very excited to have to participants from the David Suzuki Foundation at the hackathon. They worked on creating some maps that would allow people to crowdsource map road kills, and instances of poaching, across the province of British Columbia. I love that they had a chance to explore the technical side of this problem, particularly as they may be well placed to resolve the community building side that would be essential to making a project like this a success.

Neighbourhood quality Heat Maps

Another team took various data sets from the Vancouver Open Data portal to generate heat maps of data quality (proximity to certain services and other variables). This prompted a robust conversation about the methodologies used to assess quality as well as how to account for services vs. population density. Exactly the types of conversations we want to foster!

Figuring our how to translate all of the data.vancouver.ca datasets

Another participant  Jim DeLaHunt – put in some infrastructure that would make it easier to translate Vancouver’s open data into multiple languages in order to make it more accessible. He spent the day trying to identify what data in which data sets was structured versus unstructured human readable text. And… much to his credit he created a wiki page, the  Vancouver Open Data language census to update people on his work so far.

Live Bus Data Mapped

Transit mapping

Another team played with the local transit authority’s real time bus data location API. It was pretty cool to see the dots moving across a google map in real time.

Their goals were mostly just to experiment, play and learn, but I know that apps like this have been sold into coffee shops in Boston, where they let customers know how far away the next bus.

Open Street Map

A Open Street Mapper participant spent the data getting address data merged with OSM.

Key Lessons:

  • Don’t try to over manage the event – give people space and time to create
  • Even if the energy feels low after a long day – definitely share out what people worked on, even if they didn’t finish what they wanted. There is lots to be learned from what others are doing and many new ideas get generated. It was also great for city staff to see what is possible
  • Get people to share github repos and other links while on site. Too many of the above projects lack links!

Thank you again for everyone who made Open Data Day in Vancouver a success! Looking forward to next year!

International Open Data Day Feb 23rd: Vancouver Edition

So International Open Data is rapidly approaching! All around the world people are organizing local events to bring together developers, designers, policy wonks, non-profits, government officials, journalists, everyday citizens and others to play, chart, analyze, educate and/or build apps with open data.

For those of us who started International Open Data Day, it was never designed to be just a hackathon. Rather we’ve always wanted it to be an event that anyone interested in data, and interested in open data about their community in particular, could come to. So if you live in Vancouver and that is you… please sign up here. If you live somewhere else, check out the wiki as there are events happening all around the world.

So what do we have planned in Vancouver? And what will be some fun projects to work on?

Open Data Dating!

Well, this year, generously, the event will be taking place at City Hall and we are expecting some staff to be on hand. Following the lead from the excellent organizers in Ottawa were going to run some open data dating. Specifically, we’ll have city staff share with us what is some of the data they have, how they are using it, and answer questions participants may have. These conversations often spark ideas on behalf of both staff and participants about useful analysis or apps that could be created, or important data that should be collected.

Budget Visualization

Stéphane Guidoin from Montreal is trying to get people at Open Data Events across Canada (and possibly around the world) to input their city’s budget data into Where Does My Money Go so we can toy with creating some visualizations of city budgets. Not sure yet that we can get the budget data, but think it could be scrapped – but am nonetheless hopeful.

Homelessness and Rental Properties

One of the big priorities of city government is homelessness. The city is gearing up to launch a database of infractions affecting rental properties. Councillor Reimer – who is been a strong supporter of open data and addressing homelessness – will be on hand and has several ideas about how this data could be used to help the city, and residents, better understand the nature of some of the challenges around housing and foster support for more and better housing.

Air Quality Egg Hacking

My colleagues at the Centre for Digital Media at the Great Northern Way Campus have recently procured an Air Quality Egg and are hoping to explore how they can hack this hardware. We been dreaming up a scenario where we deploy may 10-30 of these around the lower mainland to get realtime measurements of the air quality. For the Centre for Digital Media, we’d love it if we can create a dashboard for the measurements from these eggs, as it would enable residents to compare air quality from neighborhood to neighborhood.

Biking Apps

Since I’m now just throwing ideas out there… (Cause that is what happens on open data day), another idea Councillor Reimer shared involves the newly released bike rack data from the City of Vancouver (which this fine gentleman mapped in very short order). An app that does nothing more than load, locate you, and point you to the direction of the nearest bike rack could be helpful to bikers. But if the location of the user could be anonymously shared with the city… it would be hugely valuable to them as it would provide some insight about where people are when they are looking for bike racks. This could allow the city to deploy its bike rack infrastructure more efficiently and save on (re)installation/moving costs.

And lots, lots more…

Obviously, there is lots more that happens, people network, brainstorm projects of their own, join established projects… or just learn about what is possible. Hopefully these ideas give you some insight into what is possible. That said, if you think you don’t have the right skills, please come anyways… we’ll find you a way to participate.

Presently the City of Montreal just tipped over 100 participants for their open data day. Ottawa regularly has similar participation levels. I confess that I’ve been a little slow in getting the word out, so please do consider coming and… pass the word along!


Again, one can sign up here.

The event will be taking place at City Hall on February 23rd, from 9:30am until 5:30pm.


Uber in Vancouver: Some Thoughts for the Passenger Transportation Board

So last week the B.C. Passenger Transportation Board (PTB) effectively shut down Uber in Vancouver by compelling the rides they arrange must charge a minimum $75 a trip, regardless of distance. Shortly after being announced, twitter lit up as Uber notified its customers of the decision and the hashtag #UberVanLove began directing angry (and deserved) tweets at government officials.

My thoughts on all this are evolving but I think the PTB has made a poor decision and hope that a compromise can be found.

Here’s a long piece explaining why.

Uber is different. Most people think that Uber is simply a new middleman, trying to cut out the current dispatchers (or work with them). This is not true, they are much more than that. As you can read in this Time magazine article, Uber is not just about connecting riders with drivers. For example:

Abyzov says the company has a “science team” working on dispatch algorithms to produce a predictive heat-map that helps local car companies and their drivers better anticipate rider demand. “We’re helping our partners build successful small businesses,”

So let’s be clear. This is about a learning company that is figuring out how to preposition cars in neighborhoods because it can anticipate demand. As far as I know (or have experienced) There is no taxi or town-car company in the lower-mainland that is even thinking that way. And this type of thinking has big implications. In San Francisco, it means the average wait time for an Uber car is 3 minutes.

Think about that for a second (I’m looking at you PTB).

This means that:

  • Efficiency: People are getting around the city much faster – increasing their productivity. For a city trying to compete globally, this matters.
  • Reliable: I’ve had taxi companies not commit to send me a car when I’m not at a fixed address because they assume I’ll hop in a roaming taxi before the one I ordered arrives. Because Uber let’s you rate the taxi, but also lets the taxi rate you, it increases the reliability of both taxis and passengers. This means fewer taxies chasing passengers who aren’t there, and fewer passengers left stranded by untrusting dispatchers.
  • Fewer cars: People are much more likely to get out of their car (or not own one at all) if they know they have reliable alternatives. Public transit and car sharing are important to this, and a highly effective car service, available at one’s finger tips would be a powerful addition to the mix. Speaking of reliable: a 3 minute average is pretty god damn reliable. Certainly more reliable than the taxi experience many receive in Vancouver.
  • Greener: Pre-positioning cars in neighborhoods where you can predict demand means fewer cars trolling for fares. In addition, because they are nearer to their fares, Uber cars are doubly more efficient. This means fewer carbon emissions. Also, more Uber rides means less pressure on downtown parking and, as I mentioned above, possibly fewer cars on the road.
  • Serve more neighborhoods: When you can predict demand it means you’ll better serve those pesky “under-served” suburban neighbourhoods Rather than having everybody chasing fares in the busiest part of town, you can be more strategic about how you deploy your cars.
  • Convient: Using the app is just easier. I can order a taxi in a crowded bar without having to talk to (and thus be misheard) by the dispatcher. As a user, the thing I’ve loved most about Uber is that when you book a car, you get to see where it is. So rather than relying on the dispatcher “assuring” you the car is only 5 minutes away, you can see on the make exactly where it is. (This is a bonus for those with awkward addresses, I’ve actually guided lost drivers to my location when I’ve been in a complicated cul-de-sac).

The other mistake is to assume that Uber is about town cars. Here in Vancouver the cosy oligarchy of taxis companies – and (from what I understand) the complete lack of independent taxis – means that they don’t want to work with Uber. And yet, while I’m an Uber user I’ve actually only used its town-car service once (to try it out), I mostly use Uber for taxis – while traveling on business in Toronto. Again, there are benefits.

  • Foreigner friendly: As someone less familiar with street addresses in Toronto, and totally unaware of taxi phone numbers, Uber locates me and brings a taxi to me. I don’t have to know much about my address. This makes it exceedingly tourist friendly. In addition, drivers are rated… so I can choose not to use poorly rated drivers – a major benefit. Last time I checked, tourism was big business in Vancouver. Wouldn’t it be nice if we made our city even easier to navigate for tourists?
  • Better for independent drivers: While some observers rail that Uber is a “foreign firm” it could be a valuable supplier for independent taxi drivers (were we to have any). As such, it might support a broader taxi driver community, one that was not beholden to one of the four players in our market. That, one would think, would be good for taxi drivers (but admittedly, potentially less good for big four companies who presently can take $522 taxi license the city issues and then resell it to drivers for $250,000-$500,000 per shift. That’s a pretty serious mark up. And while I’m sure it is great for the taxi companies… it is less clear to me how the city government, taxpayer, taxi user, or taxi drivers. Feels like a lot of lost tax revenue, or expensive barrier to entry. Heaven forbid we break up that arrangement. For more on the shady world of the taxi business in Vancouver, I suggest you read this excellent article by Luke Brocki.

The PTB should engage Uber and find a compromise because you know, I know, and everyone knows, that the types of innovations I describe above aren’t going to emerge organically out of the taxi industry in Vancouver (or, in any city for that matter). Kill Uber and you kill any incentive for the taxi industry to engage with the future. And frankly, that’s a pretty crappy outcome for everyone who takes taxis.

But, it gets worse. The PTB needs to know that failing to engage in Uber won’t make this problem go away. Uber is a downright straightforward problem/opportunity to manage. What is the PTB going to do when Hailo, Lyft, or SideCar elects to expand to Vancouver? Will we have to sit back and watch with envy as Torontonians, New Yorkers, San Franciscans, Londoners, Washingtonians (the list goes on and on) and others enjoy these services?

I’m not saying the PTB should accomodate Uber, I’m saying the PTB needs a strategy to accomodate a whole wave of innovators that are going to descend on the transportation business. Uber is just an opportunity to being figuring this out. Sticking your head in the sand isn’t going to make these issues go away. More disruptive alternatives are on the way. You’d better start engaging this stuff today, while we passengers only hate you a little bit.

Vancouverites deserve a world class taxi and town car service. One that innovates and offers world class service. Today we have a company that is trying to do that, and more that are likely on the way. It would be nice if we had a PTB that worked with them rather than against them.

Some Additional Thought and Caveats on this Piece and this Issue.

1. Minister’s Response.

To describe the response by the minister responsible, Mary Polak as disappointing would be an understatement. Given she appoints the PTB and likely has some influence, she washed her hands of the issue so fast it she has little interest understanding what is actually going on. (For those who are upset at the PTB decision, I’d focus your tweets at her – particularly as she has gotten off relatively lightly.). My hope is that her, or someone in her staff, will see this piece and see that this issue won’t be going away, it is going to get bigger.

2. Some Thoughts on Uber

For those who who don’t like Uber and those interested in a little history:

Firstly. Yes, I am aware that Uber founder Travis Kalanick is a both fan of Ayn Rand and a fairly uncompromising person. Personally, I’m not a fan Ayn Rand’s writings. I think her books are terrible and that her understanding of how markets and society work (to say nothing of human relationships) is deeply, deeply flawed and certainly lacks nuance. And while some people use this as a basis to write mean articles about Kalanick I think it is a pretty poor line of attack. While I may disagree with its founders ideology (if that is what it is), I’m much more interested in the company’s impact and business model.

In regards to Kalanick being hardheaded (or other, less flattering descriptors), I’m aware of that too. Of course, the people who judge him are usually those who have not tried to do a start up, much less one that tries to alter a sometimes more than 100 year old industry that does not always benefit consumers (or its drivers). Do I agree with Uber’s approach? Not always. I think they screwed up badly in New York. At the same time, in many cities, I think they have had little choice. The current operators – who, let me remind you, compose a market oligarchy – are not exactly interested in innovation or new entrants. If you are going to try to change the way taxi service is delivered… being hardheaded is probably a job requirement. The fact that some taxi companies go after them is not a sign of them being a bully, it could be a sign that they will make the market place more competitive. Nor do I think that they mobilize their users makes them a “bully.” I find it interesting to contrast Uber with the case of PickupPal, a Canadian company that was equally at odds with similar transportation rules and who also started a massive petition (and ultimately had the law changed – much to the chagrin of bus companies). It’s noteworthy that PickupPal is not portrayed as the bully and is indeed celebrated as the triumph of the consumer over the vested interests of the status quo players.

3. Other Reading

Finally, Karen Fung has a good piece about the complexity of transport policy that I don’t really think makes the case for not letting Uber into the market, but is worth the read.

Also, as I mentioned in the piece, Luke Brocki’s piece, Taxiland, is definitely worth reading.

4. Poorly Formed Tweets

Oh, and I was disappointed to see this tweet by a journalist who I normally find quite thoughtful. A desire for more buses and for services like Uber are hardly mutually exclusive. Indeed, trying to pit the two options against each strikes me as downright counter productive. I’m in favour of all solutions that make increase options and diminish the dependency on car ownership. I’m happy to pay more taxes for better bus service, and at the same time, Uber strikes me as another (low cost) way to spark innovation and increase options.

Re-Architecting the City by Changing the Timelines and Making it Disappear

A couple of weeks ago I was asked by one of the city’s near where I live to sit on an advisory board around the creation of their Digital Government strategy. For me the meeting was good since I felt that a cohort of us on the advisory board were really pushing the city into a place of discomfort (something you want an advisory board to do in certain ways). My sense is a big part of that conversation had to do with a subtle gap between the city staff and some of the participants around what a digital strategy should deal with.

Gord Ross (of Open Roads) – a friend and very smart guy – and I were debriefing afterwards about where and why the friction was arising.

We had been pushing the city hard on its need to iterate more and use data to drive decisions. This was echoed by some of the more internet oriented members of the board. But at one point I feel like I got healthy push back from one of the city staff. How, they asked, can I iterate when I’ve got 10-60 years timelines that I need to plan around? I simply cannot iterate when some of the investments I’m making are that longterm.

Gord raised Stewart Brands building layers as a metaphor which I think sums up the differing views nicely.

Brand presents his basic argument in an early chapter, “Shearing Layers,” which argues that any building is actually a hierarchy of pieces, each of which inherently changes at different rates. In his business-consulting manner, he calls these the “Six S’s” (borrowed in part from British architect and historian F. Duffy’s “Four S’s” of capital investment in buildings).

The Site is eternal; the Structure is good for 30 to 300 years (“but few buildings make it past 60, for other reasons”); the Skin now changes every 15 to 20 years due to both weathering and fashion; the Services (wiring, plumbing, kitchen appliances, heating and cooling) change every seven to 15 years, perhaps faster in more technological settings; Space Planning, the interior partitioning and pedestrian flow, changes every two or three years in offices and lasts perhaps 30 years in the most stable homes; and the innermost layers of Stuff (furnishings) change continually.

My sense is the city staff are trying to figure out what the structure, skin and services layers should be for a digital plan, whereas a lot of us in the internet/tech world live occasionally in the services layer but most in the the space planning and stuff layers where the time horizons are WAY shorter. It’s not that we have to think that way, it is just that we have become accustomed to thinking that way… doubly so since so much of what works on the internet isn’t really “planned” it is emergent. As a result, I found this metaphor useful for trying to understanding how we can end up talking past one another.
It also goes to the heart of what I was trying to convey to the staff: that I think there are a number of assumptions governments make about what has been a 10 or 50 year lifecycle versus what that lifecycle could be in the future.
In other words, a digital strategy could allow some things “phase change” from being say in the skin or service layer to being able to operate on the faster timeline, lower capital cost and increased flexibility of a space planning layer. This could have big implications on how the city works. If you are buying software or hardware on the expectation that you will only have to do it every 15 years your design parameters and expectations will be very different than if it is designed for 5 years. It also has big implications for the systems that you connect to or build around that software. If you accept that the software will constantly be changing, easy integration becomes a necessary feature. If you think you will have things for decades than, to a certain degree, stability and rigidity are a byproduct.
This is why, if the choice is between trying to better predict how to place a 30 year bet (e.g. architect something to be in the skin or services layer) or place a 5 year bet (architect it to be in the space planning or stuff layer) put as much of it in the latter as possible. If you re-read my post on the US government’s Digital Government strategy, this is functionally what I think they are trying to do. By unbundling the data from the application they are trying to push the data up to the services layer of the metaphor, while pushing the applications built upon it down to the space planning and stuff layer.
This is not to say that nothing should be long term, or that everything long term is bad. I hope not to convey this. Rather, that by being strategic about what we place where we can foster really effective platforms (services) that can last for decades (think data) while giving ourselves a lot more flexibility around what gets built around them (think applications, programs, etc…).
The Goal
The reason why you want to do all this, is because you actually want to give the city the flexibility to a) compete in a global marketplace and b) make itself invisible to its citizens. I hinted at this goal the other day at the end of my piece in TechPresident on the UK’s digital government strategy.
On the competitive front I suspect that across Asia and Africa about 200 cities, and maybe a lot more, are going to get brand new infrastructure over the coming 100 years. Heck some of these cities are even being built from scratch. If you want your city to compete in that environment, you’d better be able to offer new and constantly improving services in order to keep up. If not, others may create efficiencies and discover improvements that given them structural advantages in the competition for talent and other resources.
But the other reason is that this kind of flexibility is, I think, critical to making (what Gord now has me referring to as the big “C” city) disappear. I like my government services best when they blend into my environment. If you live a privilidged Western World existence… how often do you think about electricity? Only when you flick the switch and it doesn’t work. That’s how I suspect most people want government to work. Seamless, reliable, designed into their lives, but not in the way of their lives. But more importantly, I want the “City” to be invisible so that it doesn’t get in the way of my ability to enjoy, contribute to, and be part of the (lower case) city – the city that we all belong to. The “city” as that messy, idea swapping, cosmopolitan, wealth and energy generating, problematic space that is the organism humans create where ever the gather in large numbers. I’d rather be writing the blog post on a WordPress installation that does a lot of things well but invisibly, rather than monkeying around with scripts, plugins or some crazy server language I don’t want to know. Likewise, the less time I spend on “the City,” and the more seamlessly it works, the more time I spend focused on “the city” doing the things that make life more interesting and hopefully better for myself and the world.
Sorry for the rambling post. But digesting a lot of thoughts. Hope there were some tasty pieces in that for you. Also, opaque blog post title eh? Okay bed time now.

How Government should interact with Developers, Data Geeks and Analysts

Below is a screen shot from the Opendatabc google group from about two months ago. I meant to blog about this earlier but life has been in the way. For me, this is a prefect example of how many people in the data/developer/policy world probably would like to interact with their local, regional or national government.

A few notes on this interaction:

  • I occasionally hear people try to claim the governments are not responsive to requests for data sets. Some aren’t. Some are. To be fair, this was not a request for the most controversial data set in the province. But it is was a request. And it was responded to. So clearly there are some governments that are responsive. The questions is figuring out which one’s are, why they are, and see if we can export that capacity to other jurisdictions.
  • This interaction took place in a google group – so the whole context is social and norm driven. I love that public officials in British Columbia as well as with the City of Vancouver are checking in every once in a while on google groups about open data, contributing to conversations and answering questions that citizens have about government, policies and open data. It’s a pretty responsive approach. Moreover, when people are not constructive it is the group that tends to moderate the behaviour, rather than some leviathan.
  • Yes, I’ve blacked out the email/name of the public servant. This is not because I think they’d mind being known or because they shouldn’t be know, but because I just didn’t have a chance to ask for permission. What’s interesting is that this whole interaction is public and the official was both doing what that government wanted and compliant with all social media rules. And yet, I’m blacking it out, which is a sign of how messed up current rules and norms make citizens relationships with public officials they interact with online -I’m worried of doing something wrong by telling others about a completely public action. (And to be clear, the province of BC has really good and progressive rules around these types of things)
  • Yes, this is not the be all end all of the world. But it’s a great example of a small thing being doing right. It’s nice to be able to show that to other government officials.


Living in the Future: My Car isn’t Flying, but it is Cheap and Gamified

I remember in the early 80’s when I was about 8 years old I walked up to my dad and said “you know the year 2000 really isn’t that far away, and unless something changes we aren’t going to get jetpacks and flying cars.” Even then I could see the innovation curve wasn’t going to meet the expectations movies and books had set for me.

Mostly I’m glad I reset my expectations at such an early age – since it is fairly rare that something comes along that makes me feel like I live in the future: things like the iPad and smartphones. Interestingly however, what feels most like magic to me these days – the thing I do regularly but that feels like it is the future – isn’t something I own, but a service that is all about whatI don’t have to own. A car.

A Car So Cheap, I don’t Own It

I actually belong to two car sharing entities: Modo (like Zipcar) and Car2Go. While I love both it is that latter that really has me feeling like I live in the future.

What makes Car2Go so amazing is that unlike ZipCar and Modo, which have fixed parking spots to which cars must be picked up and returned, Car2Go essentially scattered 600 cars around Vancouver. There are no dedicated parking spots to which you must return the car. You can leave it anywhere in the city that isn’t private parking or metered.

So, to lay it out. Here’s the process of using one of these cars:

  1. Fire up your smart phone and locate the nearest car – generally within 10-400 meters.
  2. Walk to said car
  3. Once you arrive, hold your Car2Go card against the windshield to “sign in” to the car
  4. Get in and start driving to your destination.
  5. Upon arrival, “sign out” by holding your card against the windshield

I then automatically get billed at $0.35 a minute for use, so basically a 10 minute car ride (about the average length of a trip when in Vancouver) comes to $3.50, about $1 more than bus fare. I can’t even begin to describe the convenience of this service. What it saves me over having to own a car… mind boggling. Between walking, transit, car2go, modo, taxis and uber…. living without owning a car has never been easier, even with a 7 month old.

But again, the magic is that, where ever I am in the city, I can pull up my phone, generally find a car within 2-3 minutes walk and drive anywhere I want without having to plan it all beforehand. There are, quite literally, cars scattered around Vancouver, at my disposal. Brilliant.

Gamifying my Car to help the environment

Once you get into a Car2Go (they are all two seater Smart cars built by Mercedes-Benz) there is a little screen that allows you to control a map and the radio. The other day however, I noticed a little green leaf icon with a number in it, so pushed that “button” to see what would happen.

Turns out Car2Go has a gamified driving. The onboard computer measures your performance around acceleration, cruising and deceleration and provides you with a score that reflects your performance. I took the photo below at the end of a ride the other day.

green-dashboard

What determines your score – from what I can tell-  is your efficiency around accelerating, cruising and decelerating. So the more smoothly you brake the gentler your acceleration (not an easy feat in a Smart Car) the better your score. Cruising appears to be about smoothness as well.

Once you are aware of these scoreboard – even if you are not looking at it and it is only in the back of your mind – I find myself trying to drive more smoothly.

In the subtitle, I point out that all this probably helps the environment by reducing the amount of gas consumed by Car2Go drivers. But I bet it also helps reduce maintenance costs on Car2Go’s cars. I’m sure many people are rougher on shared cars than they are on their own and that this gamification helps dampen that effect.

Either way, if you’d asked my six year old self if I’d not own a car when I’m 35, and that I’d actually be sharing a car with hundreds of other residents that I could swipe into using a simple card and that had a game inside it that urged me to drive more sustainable.. I suspect I’d just looked confused. But using Car2Go is probably the closest I get, on a regular basis, to doing something I really couldn’t have imagined when I was 6. And that’s kind of fun.

NASA space hackathon (in Vancouver) this weekend

So, many, many things I’d like to blog upon at the moment. I’m in Brasilia at the Open Government Partnership meeting, so obviously lots to talk about there, and, of course, Canada Post has completely lost it and is suing a company over postal code data but it’s been twenty hour days and those post more thought (and rest).

In the mean time, if you are in Vancouver, the very cool people over at Steam Clock Software – and Angelina Fabbro in particular – are organizing the Vancouver edition of the NASA International Space Apps challenge THIS WEEKEND at the Network Hub.

You should feel free to show up as a team, or come on your own and join a team. It’s worth checking this out now, as there is some pretty rich data sets to explore so getting familiar with it before hand is… recommended.

Mostly I just love that NASA is thinking this way.

It’s also good that the Canadian government is not involved, since even getting them to acknowledge there participation would have proven too controversial (and sucked up a ton of public servants time).

Space geeks… unite!

Citizen Surveillance and the Coming Challenge for Public Institutions

The other day I stumbled over this intriguing article which describes how a group of residents in Vancouver have started to surveille the police as they do their work in the downtown eastside, one of the poorest and toughest neighborhoods in Canada. The reason is simple. Many people – particularly those who are marginalized and most vulnerable – simply do not trust the police. The interview with the founder of Vancouver Cop Watch probably sums it up best:

“One of the complaints we have about District 2 is about how the Vancouver police were arresting people and taking them off to other areas and beating them up instead of taking them to a jail,” Allan told the Georgia Straight in a phone interview. “So what we do is that, when in the Downtown Eastside, whenever we see the police arresting someone, we follow behind them to make sure that the person makes it to the jail.”

In a world where many feel it is hard to hold accountable government in general and police forces specifically, finding alternative means of creating such accountability will be deeply alluring. And people no longer need the funding and coordination of organizations like Witness (which initially focused on getting videocameras into peoples hands in an effort to prevent human rights abuses). Digital video cameras and smart phones coupled with services like youtube now provide this infrastructure for virtually nothing.

This is the surveillance society – predicted and written about by authors like David Brin – and it is driven as much by us, the citizens, as it is by government.

Vancouver Cop Watch is not the first example of this type of activity – I’ve read about people doing this across the United States. What is fascinating is watching the state try to resist and fail miserably. In the US the police have lost key battles in the courts. This after the police arrested people filming them even when while on their own property. And despite the ruling people continue to be arrested for filming the police – a choice I suspect diminishes public confidence in the police and the state.

And it is not just the police getting filmed. Transit workers in Toronto have taken a beating of late as they are filmed asleep on the job. Similarly, a scared passenger filmed an Ottawa bus driver who was aggressive and swearing at an apologizing mentally ill passenger. A few years ago the public in Montreal was outraged as city crews were filmed repairing few potholes and taking long breaks.

The simple fact is, if you are a front line worker – in either the private, but especially, the public sector – there is a good chance that at some point in your career you’re going to be filmed. And even when you are not being filmed, more data is going to be collected about what you do and how you do it.

Part of this reality is that it is going to require a new level of training for front line workers, this will be particularly hard on the police, but they should expect more stories like this one.

I also suspect there will be two reactions to it. Some government services will clam up and try to become more opaque, fearing all public inquiry. Their citizens – armed with cameras – all become potential threats. Over time, it is hard not imagining their legitimacy becoming further and further eroded (I’m thinking of you RCMP) as a video here, and audio clip there, shapes the publics image of the organization. Others will realize that anecdotal and chance views of their operations represents a real risk to their image. Consequently they may strive to be more transparent – sharing more data about their operations and their processes – in an effort to provide the public with greater context. The goal here will be to provide a counter point to any unfortunate incidents, trying to make a single negative anecdotal data point that happened to be filmed part of a larger complex number of data points.

Obviously, I have strong suspicions regarding which strategy will work, and which one won’t, in a democratic society but am confident many will disagree.

Either way, these challenges are going to require adaptation strategies and it won’t be easy for public institutions adverse to both negative publicity and transparency.