Tag Archives: data

The Past, Present and Future of Sensor Journalism

This weekend I had the pleasure of being invited to the Tow Centre for Digital Journalism at the Columbia Journalism School for a workshop on sensor journalism.

The workshop (hashtag #towsenses) brought together a “community of journalists, hackers, makers, academics and researchers to explore the use of sensors in journalism; a crucial source of information for investigative and data journalists.” And, it was fascinating to talk about what role sensors – from the Air Quality Egg to aerial drones – should, could or might play in journalism. Even more fun with a room full of DIYers, academics and journalists with interesting titles such as “applications division manager” or “data journalist.” Most fascinating was a panel on the ethics of sensors in journalism of which I hope to write about another time.

There is, of course, a desire to treat sensors as something new in journalism. And for good reason. Much like I’m sure there were early adopters of camera’s in the newsroom, cameras probably didn’t radically change the newsroom until they were (relatively) cheap, portable and gave you something your audience wanted. Today we may be experiencing something similar with sensors. The costs of creating sophisticated sensors is falling and/or other objects, like our cell phones, can be repurposed to be sensors. The question is… like cameras’ how can the emergence of sensors help journalists? And how might they distract them?

My point is, well, they already do sensor journalism. Indeed, I’d argue that somewhere between 5-15% of many news broadcasts are consumed with sensor journalism. At the very minimum the weather report is a form of sensor journalism. The meteorological group is a part of the news media organization that is completely reliant on sensors to provide it with information which it must analyze and turn into relevant information for its audience. And it is a very specific piece of knowledge that matters to the audience. They are not asking for how the weather came about, but merely and accurate prediction of what the weather will be. For good or (as I feel) for ill, there is not a lot of discussions about climate change on the 6 o’clock news weather report. (As an aside Clay Johnson cleverly pointed out that weather data may also be the government’s oldest, most mature and economically impactful open data set).

Of course weather data is not the only form of sensor journalism going on on a daily basis. Traffic reports frequently rely on sensors, from traffic counting devices to permanently mounted visual sensors (cameras!) that allow one to count, measure, and even model and predict traffic. There may still be others.

So there are already some (small) parts of the journalism world that are dependent on sensors. Of course, some of you may not consider traffic reports and weather reports to be journalism since it is not, well, investigative journalism. But these services are important, have tended to be part of news gathering organizations and are in constant demand by consumers. And while demand may not always the most important metric, it is an indication that this matters to people. My broader point here is that, there is part of the media community that is used to dealing with a type of sensor journalism. Yes, it has low ethical risk (we aren’t pointing these sensors at humans really) but it does mean there are policies, processes, methodologies and practices for thinking about sensors that may exist in news organizations, if not in the newsroom.

It is also a window in the the types of stories that sensors have, at least in the past, been good at helping out with. Specifically there seem to be two criteria: things that both occur at, and that a large number of people want to know about at, a high frequency. Both weather and traffic fit the bill, lots of people want to know about them, often twice a day, if not more frequently. So it might be worth thinking about, what are the other types of issues or problems that interest journalist that do, or could conform, with that criteria? In addition, if we are able to lower the cost of gathering and analyzing the data, does it become feasible, or profitable to serve smaller, niche audiences?

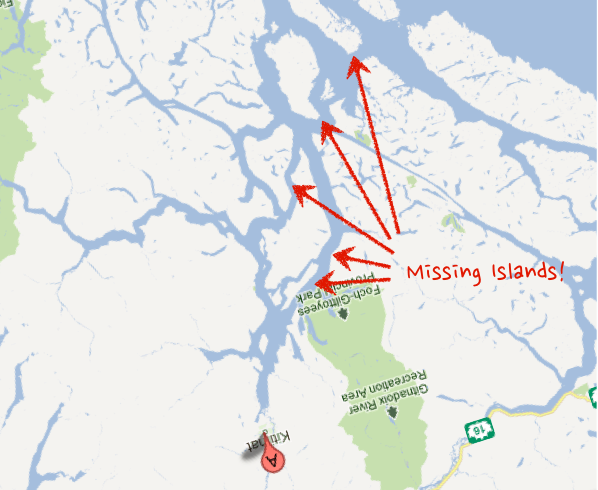
None of this is to say that sensors can’t, won’t or shouldn’t be used to cover investigative journalism projects. The work Public Labs did in helping map the extent of the oil spill along the gulf coast is a fantastic example of where sensors may be critical in journalism (as well as advocacy and evidence building) as has been the example of groups like Safecast and others who monitored radioactivity levels in Japan after the  Fukushima disaster. Indeed I think the possibilities of sensors in investigative journalism are both intriguing, and potentially very, very bright. I just love for us to build off of work that is already being done – even if it is in the (journalistically) mundane space of traffic and weather rather than imagine we are beginning with an entirely blank slate.


Lying with Maps: How Enbridge is Misleading the Public in its Ads

The Ottawa Citizen has a great story today about an advert by Enbridge (the company proposing to build a oil pipeline across British Columbia) that includes a “broadly representational” map that shows prospective supertankers steaming up an unobstructed Douglas Channel channel on their way to and from Kitimat – the proposed terminus of the pipeline.

Of course there is a small problem with this map. The route to Kitimat by sea looks nothing like this.

Take a look at the Google Map view of the same area (I’ve pasted a screen shot below – and rotated the map so you are looking at it from the same “standing” location). Notice something missing from Enbridge’s maps?

Kitimate-Google2

According to the Ottawa Citizens story an Enbridge spokesperson said their illustration was only meant to be “broadly representational.” Of course, all maps are “representational,” that is what a map is, a representation of reality that purposefully simplifies that reality so as to aid the reader draw conclusions (like how to get from A to B). Of course such a representation can also be used to mislead the reader into drawing the wrong conclusion. In this case, removing 1000 square kilometers that create a complicated body of water to instead show that oil tankers can steam relatively unimpeded up Douglas Channel from the ocean.

The folks over at Leadnow.ca have remade the Enbridge map as it should be:

EnbridgeV2

Rubbing out some – quite large – islands that make this passage much more complicated of course fits Enbridge’s narrative. The problem is, at this point, given how much the company is suffering from the perception that it is not being fully upfront about its past record and the level of risk to the public, presenting a rosy eyed view of the world is likely to diminish the public’s confidence in Enbridge, not increase their confidence in the project.

There is another lesson. This is great example of how facts, data and visualization matter. They do. A lot. And we are, almost every day, being lied to through visual representations from sources we are told to trust. While I know that no one thinks of maps as open or public data in many ways they are. And this is a powerful example of how, when data is open and available, it can enable people to challenge the narratives being presented to them, even when those offering them up are powerful companies backed by a national government.

If you are going to create a representation of something you’d better think through what you are trying to present, and how others are going to see it. In Enbridge’s case this was either an effort at guile gone horribly wrong or a communications strategy hopelessly unaware of the context in which it is operating. Whoever you are, and whatever you are visualization – don’t be like Enbridge – think through your data visualization before you unleash it into the wild.

Real Estate as Platform: Canadian Real Estate Industry looking for developers

As some readers know, I’ve been asked from time to time by members of the real estate industry to comment on the future of their industry, how technology might impact it and how open data (both the government variety, and the trend by regulators to make the industry’s data more open) may alter it.

It is with some interest that I point readers, as well as software vendors and others, to this Request for Information (RFI) issued by the Canadian Real Estate Association yesterday. The RFI is titled: A National Shared Development Platform and App Marketplace and this line from the RFI is particularly instructive:

This Request for Information (RFI) is issued by The Canadian Real Estate Association (CREA) to qualified service providers who may be interest in creating a National Shared Development Platform where certified, independent software vendors (ISVs) and data providers could develop, extract and combine data to generate new tools and services for REALTORS® and their clients.

In other words, from my reading it looks like the industry is seeking a data sharing portal that can serve as a platform for internally and externally driven innovation. It is very aligned with what I’ve been suggesting, so will be interesting to see how it evolves.

Intrigue.


Inferring Serial Killers with Data: A Lesson from Vancouver

For those happily not in the know, my home town of Vancouver was afflicted with a serial killer during the 80’s and 90’s who largely targeted marginalized women in the downtown eastside – the city’s (and one of the country’s) poorest neighborhoods.

The murderer – Robert Pickton – was ultimately caught in February 2002 and, in December 2007, was convicted on 6 accounts of second degree murder. He is accused of murdering an additional twenty women, and may be responsible for deaths of a number more.

Presently there is an inquiry going on in Vancouver regarding the failure of the policy to investigate and act earlier on the disappearing women. Up until now, the most dramatic part of the inquiry for me had been heart wrenching testimony from one female officer whose own efforts within the Police Department went largely ignored. But I’ve recently seen a new spat of articles that are more interesting and disturbing.

It turns out that during the late 1990s the Vancouver Policy Department actually had an expert analyzing crime data – particularly regarding the disappearing women – and his assessment was that a serial murder was at work in the city. The expert, Kim Rossmo, advised the police to issue a press release and begin to treat the case more seriously.

He was ignored.

The story is relatively short, but worth the read – it can be found here.

What’s particularly discouraging is looking back at past articles, such as this Canadian Press piece which was published in June 26th, 2001, less than a year before Pickton was caught:

Earlier that day, Hughes stood with six others outside a Vancouver courthouse and told passers-by she believes a serial killer is responsible.

Vancouver police officially reject the suggestion.

But former police officer Kim Rossmo supported it while he was a senior officer. He wanted to warn residents about the possible threat. Rossmo is now involved in a wrongful dismissal trial against the force in B.C. Supreme Court.

Last week, he testified he wanted to issue a public warning in 1998, but other officers strongly objected. The force issued a news release saying police did not believe a serial killer was behind the disappearances.

Indeed, Rossom was not just ignored, other policemen on the force actively made his life difficult. He was harassed and further data that would have helped him engage in his analysis was withheld from him. Of course a few months later the murder was caught, demonstrating that his capture might have happened much earlier, if the force had taken the potential problem seriously.

A few lessons from this:

1) Data matters. In this case, the use of data could have, literally, saved lives. Rossom’s data model is now used by other forces and has become a professor in the United States.

2) The challenge with data is as often cultural as it is technical. As with the Moneyball story, the early advocates of using data to analyze and reassess a problem are often victimized. Their approach threatens entrenched interests and, the work often is conducted by people on the margins. Rossom was the first PhD in Canada to become a police officer – I’m pretty sure that didn’t make him a popular guy. Moreover, his approach implicitly, and then explicitly suggested the police were wrong. Police forces don’t deal with errors well – but nor do many organizations or bureaucracies.

3) Finally, this case study says volumes about police forces capacity to deal with data. Indeed, some of you may remember that the other week I deconstructed the Vancouver Police Department’s misleading press release regarding its support for Bill-C30 which would dramatically increase the police’s power to monitor Canadians online. I find it ironic that the police are seeking access to more data, when they have been unable to effectively use data that they can already legal acquire (or that, frankly is open, such as the number and locations of murder/disappearance victims).

Data Wars: A mini-case study of Southwest Airlines vs. TripIt and Orbitz

As a regular flyer, I’m an enormous fan of TripIt. It’s a simple service in which you forward almost any reservation – airline, hotel, car rental, etc… to plans@tripit.com and their service will scan it, grab the relevant data, and create a calendar of events for you. While it’s a blessing not to have to manually enter my travel plans into my calendar, what’s particularly fantastic is that I give my partner access to the calendar – so she knows when I’m flying out and when I return. With 135,000 miles of travel last year alone, there was a lot of that.

TripIt Pro users, however, have added benefits: they can use TripIt to track how many loyalty points they are gathering. That is, unless you travel on Southwest Airlines. Apparently Southwest sent a legal warning to any company that tracks their members’ loyalty benefits and ordered them to stop doing so. (Award Wallet is another example of an app I use that was affected). In a similar vein, veteran travelers know that Southwest does not appear on many travel search sites like Orbitz.

These are great examples of a data wars – places where a company are fighting over who gets access to customers data. In this case Southwest is using its user license to forbids another company from displaying data Southwest generates, but that its customers might wish to share with others because it is helpful to them. It’s not just that Southwest wants to control its relationship with its customers when it comes to loyalty points, or that it wants to sell them hotels and rental cars though its site. It’s that it wants the data about how you behave, about what choices you make and how you make them. Use another site to access loyalty points and they can’t track or sell to you. Ditto if you use another site to buy airfare for their flights.

Southwest isn’t nuts. But it’s a strategy that won’t work for all companies (and may not work for them) and it has real consequences.

To begin with, they are making it hard for their customers to engage their service. When traveling in the US, I regularly use Kayak and/or other types of airline aggregators – it means I never see Southwest as an option. Nor do I go to their website. The bigger irony of course is that while I frequently find fares on aggregator sites, I often book them on the airline’s site. But again, I don’t go to Southwest because they never appear in any searches I do. Maybe they don’t care about business travelers, but they are making a big trade-off – they get more data about their users and have unique opportunities to sell to them, but I suspect they get far fewer users.

In addition, they may be alienating their customers. I’m not so sure customers will feel like loyalty point data belongs to Southwest. After all, it was their dollars and flying that paid to create the data… why shouldn’t they be able to access a copy of it via an application they find useful?

This was all confirmed by an email from a friend and colleague Gary R., who recently wrote me to say:

While we love Southwest Airlines for its low prices, generous affinity programs and flexibility in changing business trips at the last moment with little consequence, their closed data sharing policy drives up our overall cost of managing travel. Entering flight information manually into TripIt is a pain, yet the service is incredible at keeping one informed during a trip, presenting a palette of options seemingly the instant things go wrong. We have chosen other carriers over Southwest on occasion because they play nicely with Orbitz and TripIt.

I can’t tell if Southwest’s tradeoffs are worth it or not. But any business person must at least recognize there is a tradeoff. That’s the real lesson. You need to find a way to value the data you collect and be able to compare it against the opportunity of a) happier clients and b) potentially accessing more clients. This is particularly true since many customers probably (and rightly) will feel that is data is as much theirs as it is yours. They did co-create it.

Ultimately if you increase the transaction costs of the experience – because you want to shut other actors out – you will lose customers.  Southwest already has.

Definitely expect more of these types of legal battles in the future. Your data is now as important as the service you use. This makes it both powerful, and dangerous in the hands of the wrong people.

The Future of Academic Research

Yesterday, Nature – one of the worlds premier scientific journals recognized University of British Columbia scientist Rosie Redfield as one of the top 10 science newsmakers of 2011.

The reason?

After posting a scathing attack on her blog about a paper that appeared in the journal Science, Redfield decided to attempt to recreate the experiment and has been blogging about her effort over the past year. As Nature describes it:

…that month, Redfield took matters into her own hands: she began attempting to replicate the work in her lab at the University of British Columbia in Vancouver, and documenting her progress on her blog (http://rrresearch.fieldofscience.com).

The result has been a fascinating story of open science unfolding over the year. Redfield’s blog has become a virtual lab meeting, in which scientists from around the world help to troubleshoot her attempts to grow and study the GFAJ-1 bacteria — the strain isolated by Felisa Wolfe-Simon, lead author of the Science paper and a microbiologist who worked in the lab of Ronald Oremland at the US Geological Survey in Menlo Park, California.

While I’m excited about Redfields blog (more on that below) we should pause and note the above paragraph is a very, very sad reminder of the state of affairs in science. I find the term “open science” to be an oxymoron. The scientific process only works when it is, by definition, open. There is, quite arguably, no such thing as “closed science.” And yet it is a reflection of how 18th century the entire science apparatus remains that Redfields awesome experiment is just that – an experiment. We should celebrate her work, and ask ourselves, why is this not the norm?

So first, to celebrate her work… when I look at Redfields blog, I see exactly what I hope the future of scientific, and indeed all academic research, will look like. Here is someone who is constantly updating their results and sharing what they are doing with their peers, as well as getting input and feedback from colleagues and others around the world. Moreover, she plays to the mediums strengths. While rigorous, she remains inviting and, from my reading, creates a more honest and human view into the world of science. I suspect that this might be much more attractive (and inspiring) to potential scientists. Consider, these two lines from one of her recent posts:

So I’m pretty sure I screwed something up.  But what?  I used the same DNA stock tube I’ve used many times before, and I definitely remember putting 3 µl of DNA into each assay tube.  I made fresh sBHI + novobiocin plates using pre-made BHI agar,, and I definitely remember adding the hemin (4 ml), NAD (80 µl) and novobiocin (40 µl) to the melted agar before I poured the plates.

and

UPDATE:  My novobiocin plates had no NovR colonies because I had forgotten to add the required hemin supplement to the agar!  How embarrassing – I haven’t made that mistake in years.

and then this blog post title:

Some control results! (Don’t get excited, it’s just a control…)

Here is someone literally walking through their thought processes in a thorough, readable way. Can you imagine anything more helpful for a student or young scientist? And the posts! Wonderfully detailed walk throughs of what has been tried, progress made and set backs uncovered. And what about the candor! The admission of error and the attempts to figure out what went wrong. It’s the type of thinking I see from great hackers as well. It’s also the type of dialogue and discussion you won’t see in a formal academic paper but is exactly what I believe every field (from science, to non-profit, to business) needs more of.

Reading it all, and I’m once again left wondering. Why is this the experiment? Why isn’t this the norm? Particularly at publicly funded universities?

Of course, the answer lies in another question, one I first ran into over a year ago reading this great blog post by Michael Clarke on Why Hasn’t Scientific Publishing Been Disrupted Already? As he so rightly points out:

When Tim Berners-Lee created the Web in 1991, it was with the aim of better facilitating scientific communication and the dissemination of scientific research. Put another way, the Web was designed to disrupt scientific publishing. It was not designed to disrupt bookstores, telecommunications, matchmaking services, newspapers, pornography, stock trading, music distribution, or a great many other industries…

…The one thing that one could have reasonably predicted in 1991, however, was that scientific communication—and the publishing industry that supports the dissemination of scientific research—would radically change over the next couple decades.

And yet it has not.

(Go read the whole article, it is great). Mathew Ingram also has a great piece on this published half a year later called So when does academic publishing get disrupted?

Clarke has a great breakdown on all of this, but my own opinion is that scientific journals survive not because they are an efficient means of transmitting knowledge (they are not – Redfield’s blog shows there are much, much faster ways to spread knowledge). Rather journals survive in their current form because they are the only rating system scientists (and more importantly) universities have to deduce effectiveness, and thus who should get hired, fired, promoted and, most importantly, funded. Indeed, I suspect journals actually impede (and definitely slow) scientific progress. In order to get published scientists regularly hold back sharing and disclosing discoveries and, more often still, data, until they can shape it in such a way that a leading journal will accept it. Indeed, try to get any scientists to publish their data in machine readable formats – even after they have published with it -it’s almost impossible… (notice there are no data catalogs on any major scientific journals websites…) The dirty secret is that this is because they don’t want others using it in case it contains some juicy insight they have so far missed.

Don’t believe me? Just consider this New York Times article on the break throughs in Alzheimer’s. The whole article is about a big break through in scientific research process. What was it? That the scientists agreed they would share their data:

The key to the Alzheimer’s project was an agreement as ambitious as its goal: not just to raise money, not just to do research on a vast scale, but also to share all the data, making every single finding public immediately, available to anyone with a computer anywhere in the world.

This is unprecedented? This is the state of science today? In an era where we could share everything, we opt to share as little as possible. This is the destructive side of the scientific publishing process that is linked to performance.

It is also the sad reason why it is a veteran, established researcher closer to the end of her career that is blogging this way and not a young, up and coming researcher trying to establish herself and get tenure. This type of blog is too risky to ones career. Today “open” science, is not a path forward. It actually hurts you in a system that prefers more inefficient methods at spreading insights, research and data, but is good at creating readily understood rankings.

I’m thrilled that Rosie Redfield has been recognized by Nature (which clearly enjoys the swipe at Science – its competitor). I’m just sad that the today’s culture of science and universities means there aren’t more like her.


Bonus material: If you want to read an opposite view, here is a seriously self-interested defensive of the scientific publishing industry that was totally stunning to read. It’s fascinating that this man and Michael Clarke share the same server. If you look in the comments of that post, there is a link to this excellent post by a researcher at a University in Cardiff that I think is a great counter point.


International Open Data Hackathon 2011: Better Tools, More Data, Bigger Fun

Last year, with only a month of notice, a small group passionate people announced we’d like to do an international open data hackathon and invited the world to participate.

We were thinking small but fun. Maybe 5 or 6 cities.

We got it wrong.

In the end people from over 75 cities around the world offered to host an event. Better still we definitively heard from people in over 40. It was an exciting day.

Last week, after locating a few of the city organizers email addresses, I asked them if we should do it again. Every one of them came back and said: yes.

So it is official. This time we have 2 months notice. December 3rd will be Open Data Day.

I want to be clear, our goal isn’t to be bigger this year. That might be nice if it happens. But maybe we’ll only have 6-7 cities. I don’t know. What I do want is for people to have fun, to learn, and to engage those who are still wrestling with the opportunities around open data. There is a world of possibilities out there. Can we seize on some of them?

Why.

Great question.

First off. We’ve got more data. Thanks to more and more enlightened governments in more and more places, there’s a greater amount of data to play with. Whether it is Switzerland, Kenya, or Chicago there’s never been more data available to use.

Second, we’ve got better tools. With a number of governments using Socrata there are more API’s out there for us to leverage. Scrapperwiki has gotten better and new tools like Buzzdata, TheDataHub and Google’s Fusion Tables are emerging every day.

And finally, there is growing interest in making “openess” a core part of how we measure governments. Open data has a role to play in driving this debate. Done right, we could make the first Saturday in December “Open Data Day.” A chance to explain, demo and invite to play, the policy makers, citizens, businesses and non-profits who don’t yet understand the potential. Let’s raise the world’s data literacy and have some fun. I can’t think of a better way than with another global open data hackathon – an maker’s fair like opportunity for people to celebrate open data by creating visualizations, writing up analyses, building apps or doing what ever they want with data.

Of course, like last time, hopefully we can make the world a little better as well. (more on that coming soon)

How.

The basic premises for the event would be simple, relying on 5 basic principles.

1. Together. It can be as big or as small, as long or as short, as you’d like it, but we’ll be doing it together on Saturday, December 3rd, 2011.

2. It should be open. Around the world I’ve seen hackathons filled with different types of people, exchanging ideas, trying out new technologies and starting new projects. Let’s be open to new ideas and new people. Chris Thorpe in the UK has done amazing work getting young and diverse group hacking. I love Nat Torkington’s words on the subject. Our movement is stronger when it is broader.

3. Anyone can organize a local event. If you are keen help organize one in your city and/or just participate add your name to the relevant city on this wiki page. Where ever possible, try to keep it to one per city, let’s build some community and get new people together. Which city or cities you share with is up to you as it how you do it. But let’s share.

4. You can work on anything that involves open data. That could be a local or global app, a visualization, proposing a standard for common data sets, scraping data from a government website to make it available for others in buzzdata.

It would be great to have a few projects people can work on around the world – building stuff that is core infrastructure to future projects. That’s why I’m hoping someone in each country will create a local version of MySociety’s Mapit web service for their country. It will give us one common project, and raise the profile of a great organization and a great project.

We also hope to be working with Random Hacks of Kindness, who’ve always been so supportive, ideally supplying data that they will need to run their applications.

5. Let’s share ideas across cities on the day. Each city’s hackathon should do at least one demo, brainstorm, proposal, or anything that it shares in an interactive way with at members of a hackathon in at least one other city. This could be via video stream, skype, by chat… anything but let’s get to know one another and share the cool projects or ideas we are hacking on. There are some significant challenges to making this work: timezones, languages, culture, technology… but who cares, we are problem solvers, let’s figure out a way to make it work.

Like last year, let’s not try to boil the ocean. Let’s have a bunch of events, where people care enough to organize them, and try to link them together with a simple short connection/presentation.Above all let’s raise some awareness, build something and have some fun.

What next?

1. If you are interested, sign up on the wiki. We’ll move to something more substantive once we have the numbers.

2. Reach out and connect with others in your city on the wiki. Start thinking about the logistics. And be inclusive. Someone new shows up, let them help too.

3. Share with me your thoughts. What’s got you excited about it? If you love this idea, let me know, and blog/tweet/status update about it. Conversely, tell me what’s wrong with any or all of the above. What’s got you worried? I want to feel positive about this, but I also want to know how we can make it better.

4. Localization. If there is bandwidth locally, I’d love for people to translate this blog post and repost it locally. (let me know as I’ll try cross posting it here, or at least link to it). It is important that this not be an english language only event.

5. If people want a place to chat with other about this, feel free to post comments below. Also the Open Knowledge Foundation’s Open Data Day mailing list will be the place where people can share news and help one another out.

Once again, I hope this will sound like fun to a few committed people. Let me know what you think.

Ada Lovelace Day – On Dr. Connie Eaves

For those who don’t know: Today – October 7th – is Ada Lovelace Day. It’s a day where you “share your story about a woman — whether an engineer, a scientist, a technologist or mathematician — who has inspired you to become who you are today.”

It would be remiss for me not to blog about Dr. Connie Eaves. For anyone who thinks I travel a lot, work long hours, or have a passion for evidence and data, I am really just a pale shadow when compared to this inspiring and globally recognized cancer researcher. For those not familiar with her – which is probably anyone outside the field of cancer research and not an avid reader of the journal Blood – you can catch her bio on Wikipedia here.

She is, of course, also my mom.

Obviously, if you are a woman (or a man) interested in getting into science – particularly human biology and stem cell research – I would point you to my mother (and father) as people to get to know, but for me her inspiration is much simpler. At a basic level, there are two invaluable gifts my mother has given me, which I feel are particularly salient to her scientific achievements.

The first, and most important, was the building blocks of critical thinking: To break down an argument and understand it from every angle, as well as dissect the evidence embedded within it. These lessons were hard ones. I learned a lot of it just through observation, and sometimes – more painfully – from trying to engage her in debate. I’ve seen graduate students tremble in fear about engaging my mother in debate. While my victories have been few, I’ve been doing it since probably the age of five or earlier, and it has helped shape my brain in powerful ways in which, I suspect, many masters or doctoral students would happily travel around the world to be exposed to. I am exceedingly lucky.

The second gift my mom bestowed me is her work ethic and drive. I have grown up believing that working for 12 hours, 7 days a week may actually be normal behaviour. There is good and bad in taking on such norms. Neither one of us probably thinks it is healthy when we skip eating all day because we zone out into our work. But that intensity has its upsides, and I’m grateful to have been exposed to it. Indeed, I’d like to think I work hard, but standing next to her, I still often just feel lazy.

I mention these two traits not just because they have had such a great impact on me, but also because I think they’re a reflection of what extraordinary skills were required by my mother to be a successful woman scientist embarking on a career in the 1960s. The simple fact is that in that era, as much as we’d like to think it was not true, I suspect that to be a women scientist – to get on tenure track – you had to be smarter and work harder than almost anyone around you. It is one reason why I think the women scientists of that generation are generally so remarkable. The sad truth is: They had to be.

The happy upside is that for me, purely selfishly, is I got the benefit of being raised by someone who survived and thrived in what I imagine was at times a hostile environment to women. Paradoxically, the benefits I enjoyed are those I would wish on any child in a heartbeat, while the asymmetric expectation are those I would wish on no one.

Happy Ada Lovelace mom.

How Dirty is Your Data? Greenpeace Wants the Cloud to be Greener

My friends over at Greenpeace recently published an interesting report entitled “How dirty is your data?
A Look at the Energy Choices That Power Cloud Computing
.”

For those who think that cloud computing is an environmentally friendly business, let’s just say… it’s not without its problems.

What’s most interesting is the huge opportunity the cloud presents for changing the energy sector – especially in developing economies. Consider the follow factoids from the report:

  • Data centres to house the explosion of virtual information currently consume 1.5-2% of all global electricity; this is growing at a rate of 12% a year.
  • The IT industry points to cloud computing as the new, green model for our IT infrastructure needs, but few companies provide data that would allow us to objectively evaluate these claims.
  • The technologies of the 21st century are still largely powered by the dirty coal power of the past, with over half of the companies rated herein relying on coal for between 50% and 80% of their energy needs.

The 12% growth rate is astounding. It essentially makes it the fastest growing segment in the energy business – so the choices these companies make around how they power their server farms will dictate what the energy industry invests in. If they are content with coal – we’ll burn more coal. If they demand renewables, we’ll end up investing in renewables and that’s what will end up powering not just server farms, but lots of things. It’s a powerful position big data and the cloud hold in the energy marketplace.

And of course, the report notes that many companies say many of the right things:

“Our main goal at Facebook is to help make the world more open and transparent. We believe that if we want to lead the world in this direction, then we must set an example by running our service in this way.”

– Mark Zuckerberg

But then Facebook is patently not transparent about where its energy comes from, so it is not easy to assess how good or bad they are, or how they are trending.

Indeed it is worth looking at Greenpeace’s Clean Cloud report card to see – just how dirty is your data?

Report-card-cloud

I’d love to see a session at the upcoming (or next year) Strata Big Data Conference on say “How to use Big Data to make Big Data more Green.” Maybe even a competition to that effect if there was some data that could be shared? Or maybe just a session where Greenpeace could present their research and engage the community.

Just a thought. Big data has got some big responsibilities on its shoulders when it comes to the environment. It would be great to see them engage on it.

Honourable Mention! The Mozilla Visualization Challenge Update

Really pleased to share that Diederik and I earned an honourable mention for our submission to the Mozilla Open Data Competition.

For those who missed it – and who find opendata, open source and visualization interesting – you can read a description of and see images from our submission to the competition in this blog post I wrote a month ago.